Of the three curves in the open-economy macro diagram, two are imported almost unchanged from closed-economy analysis. The third is new, and it is the one that carries all the open-economy content. The BP curve economics students meet in the Mundell-Fleming diagram is the schedule that adds the rest of the world to the picture, tracing every combination of output and interest rate at which a country’s external accounts are in balance. Where the IS and LM curves describe the domestic goods and money markets, the BP curve describes the country’s relationship with everyone else, and without it the open economy cannot be analyzed at all.
The curve is built directly on the accounting of the balance of payments, which records every cross-border transaction and must, by construction, sum to zero once official reserve movements are included. The BP curve takes that identity and asks a sharper question: holding the exchange rate and the rest of the world fixed, which pairs of domestic output and interest rate leave the external accounts in equilibrium? Answering that question point by point is what draws the curve, and reading the curve correctly is the prerequisite for using the full Mundell-Fleming model.
Two Forces the Curve Balances
External balance requires that the current account and the capital account offset each other. The current account is dominated by net exports, and the capital account is dominated by financial flows that respond to interest rates. The BP curve is the set of points where these two pull in equal and opposite directions, so that the overall balance of payments is zero.
External Balance Condition
Each term moves in a definite direction. When domestic output rises, households and firms buy more imports, so net exports fall and the current account moves toward deficit. When the domestic interest rate rises relative to the world rate, domestic assets become more attractive, capital flows in, and the capital account moves toward surplus. The curve exists because these two effects can cancel: a deterioration in the current account caused by higher output can be financed by an improvement in the capital account caused by a higher interest rate.
Deriving the Curve Point by Point
The upward slope follows from holding the balance at zero while output changes. Start at any point on the curve, where the accounts balance. Now suppose output rises. The higher output pulls in imports, net exports fall, and the current account slips into deficit. To return the overall balance to zero, the capital account has to improve by the same amount, which requires the domestic interest rate to rise enough to attract the necessary inflow. A higher output must therefore be paired with a higher interest rate to stay on the curve, and that positive relationship is the BP curve sloping upward in the output-interest-rate plane.

Both labelled points sit on the curve, so both describe external balance, but they balance the accounts in different ways. At point P1, output is low, so imports are modest and the current account is comfortable, which means only a low interest rate is needed to keep the capital account in line. At point P2, output is high, imports are large, and the current account is strained, so a higher interest rate is required to pull in the capital that finances the gap. Moving from P1 to P2 is not a change in the country’s external health; it is a movement along a single equilibrium schedule, trading a stronger current account for a stronger capital account as output rises.
Reading Points Off the Curve
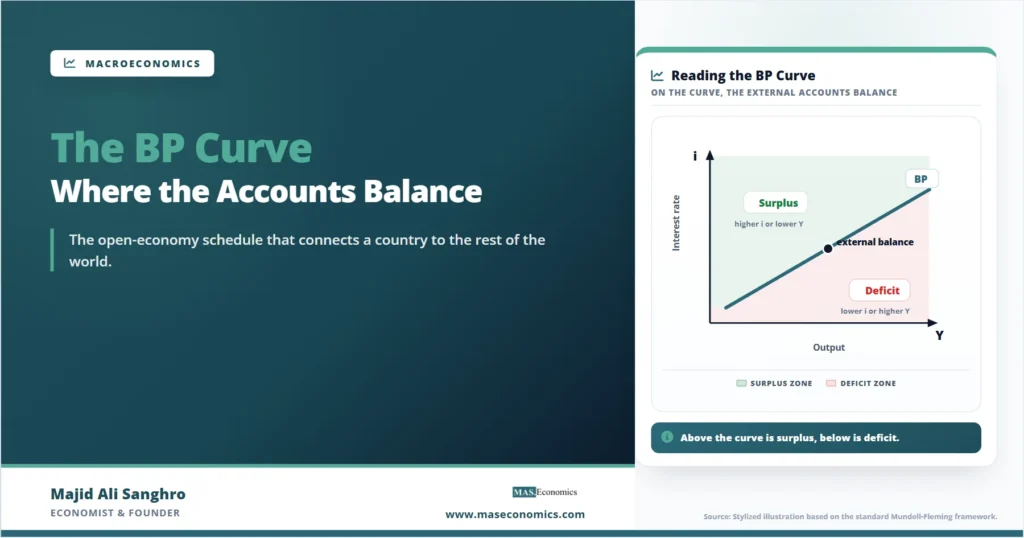
The curve also divides the plane into two regions, and the position of the economy relative to the curve tells you whether the balance of payments is in surplus or deficit. A point above and to the left of the curve has a higher interest rate, or a lower output, than balance requires, so the capital account is unusually strong, or the current account is unusually healthy. Either way, the overall balance is in surplus. A point below and to the right has a lower interest rate, or a higher output, than balance requires, so the balance of payments is in deficit.
How to read a point. On the curve, the external accounts balance. Above the curve, the balance of payments is in surplus. Below the curve, it is in deficit. The vertical distance from a point to the curve measures how far the accounts are from equilibrium.
This reading is what makes the BP curve useful inside the full diagram. When the IS and LM curves cross at a point that does not lie on the BP curve, the economy has internal balance but external imbalance, and the curve tells you the direction of the pressure. That pressure is what forces an adjustment, through reserves under a fixed exchange rate or through the currency under a float, and the BP curve is the reference line against which the adjustment is measured.
Movement Along vs Shifts of the Curve
A common source of confusion is the difference between a movement along the BP curve and a shift of the entire curve. A change in domestic output or the domestic interest rate is a movement along the curve, because both variables are the axes of the diagram. A change in anything else that affects external balance shifts the whole curve to a new position.
| Change | Effect on BP | Reason |
|---|---|---|
| Rise in domestic output | Movement along the curve | Output is an axis of the diagram |
| Rise in domestic interest rate | Movement along the curve | Interest rate is an axis of the diagram |
| Currency depreciation | Shift right (or down) | Net exports improve at every output level |
| Rise in the world interest rate | Shift up | A higher domestic rate is needed to retain capital |
| Rise in foreign income | Shift right (or down) | Stronger foreign demand lifts net exports |
|
Source: MASEconomics editorial synthesis of the Mundell-Fleming framework.
|
||
The shift factors are the variables the diagram holds constant while drawing the curve. The exchange rate is the most important of them, which is why the regime matters so much. Under a fixed rate, the exchange rate is pinned, so the BP curve stays put and the economy adjusts by moving the LM curve through reserve flows. Under a float, the exchange rate moves, so the BP curve itself shifts as the currency adjusts. The same curve behaves as a fixed backdrop in one regime and a moving target in the other, depending on which variable the regime allows to change.
Caveat. The slope of the BP curve depends on how strongly capital responds to interest-rate differences. The upward-sloping curve drawn here assumes imperfect but positive capital mobility. With perfect mobility the curve is horizontal, and with no mobility it is vertical.
Limits of a Single Curve
The BP curve is a snapshot built on fixed assumptions, and its usefulness depends on remembering them. It holds the world interest rate, foreign income, and the exchange rate constant, so it cannot by itself describe what happens when those variables move; that requires shifting the curve. It also assumes capital flows respond smoothly and predictably to the interest-rate differential, when in practice flows respond to expectations, risk, and global conditions that the simple schedule does not contain.
The curve is best understood as the external-balance reference line for a given moment, not as a description of how the external accounts evolve over time. It tells you whether the economy is in surplus, deficit, or balance at a point in time, and it tells you the direction of the resulting pressure, but it does not predict how quickly the adjustment happens or whether the underlying position is sustainable. Those questions belong to the dynamic models that build on the static diagram, and the BP curve is the foundation they start from.
Explains
Two ideas behind the BP curve
Connect the BP curve to the rest of the open-economy toolkit.
Explore the MASEconomics BlogConclusion
BP curve economics is the open‑economy addition to the Mundell‑Fleming diagram, the schedule that traces every output and interest‑rate pairing at which the external accounts balance. It slopes upward because a rise in output worsens the current account through higher imports, and only a higher interest rate, by attracting capital, can offset that deterioration and keep the overall balance at zero. Every point on the curve is an external balance achieved in a different mix of current‑account and capital‑account positions.
The curve earns its place by dividing the diagram into a surplus region above and a deficit region below, giving a clear reading of any point relative to external equilibrium. When internal balance from the IS and LM curves lands off the BP curve, the curve shows the direction of the external pressure that drives the economy’s adjustment, whether through reserves under a peg or the currency under a float.
That role makes the BP curve the hinge of open‑economy analysis. The IS and LM curves describe the domestic economy; the BP curve connects it to the world. Reading it correctly, distinguishing movement along it from shifts of it, and remembering the assumptions that hold it fixed, is what turns the open‑economy diagram from three lines into a working account of how a country balances its books with the rest of the world.
Frequently Asked Questions
What does the BP curve show?
The BP curve traces every combination of domestic output and interest rate at which the balance of payments is in equilibrium, meaning the current account and capital account sum to zero. It is the open-economy schedule in the Mundell-Fleming diagram, sitting alongside the IS and LM curves to connect the domestic economy to the rest of the world.
Why does the BP curve slope upward?
A rise in output increases imports, which worsens the current account. To keep the overall balance at zero, the capital account must improve by the same amount, which requires a higher interest rate to attract the necessary capital inflow. Higher output must therefore be paired with a higher interest rate to stay on the curve, producing the upward slope.
What does it mean to be above or below the BP curve?
A point above and to the left of the curve has a higher interest rate or lower output than balance requires, so the balance of payments is in surplus. A point below and to the right has a lower interest rate or higher output than balance requires, so the balance of payments is in deficit. Only points on the curve represent external balance.
What shifts the BP curve?
Changes in output or the domestic interest rate move the economy along the curve, because those are the diagram’s axes. Changes in the variables held constant shift the whole curve: a currency depreciation or a rise in foreign income shifts it to improve net exports, and a rise in the world interest rate shifts it upward because a higher domestic rate is then needed to retain capital.
Thanks for reading! If you found this helpful, share it with friends and spread the knowledge. Happy learning with MASEconomics