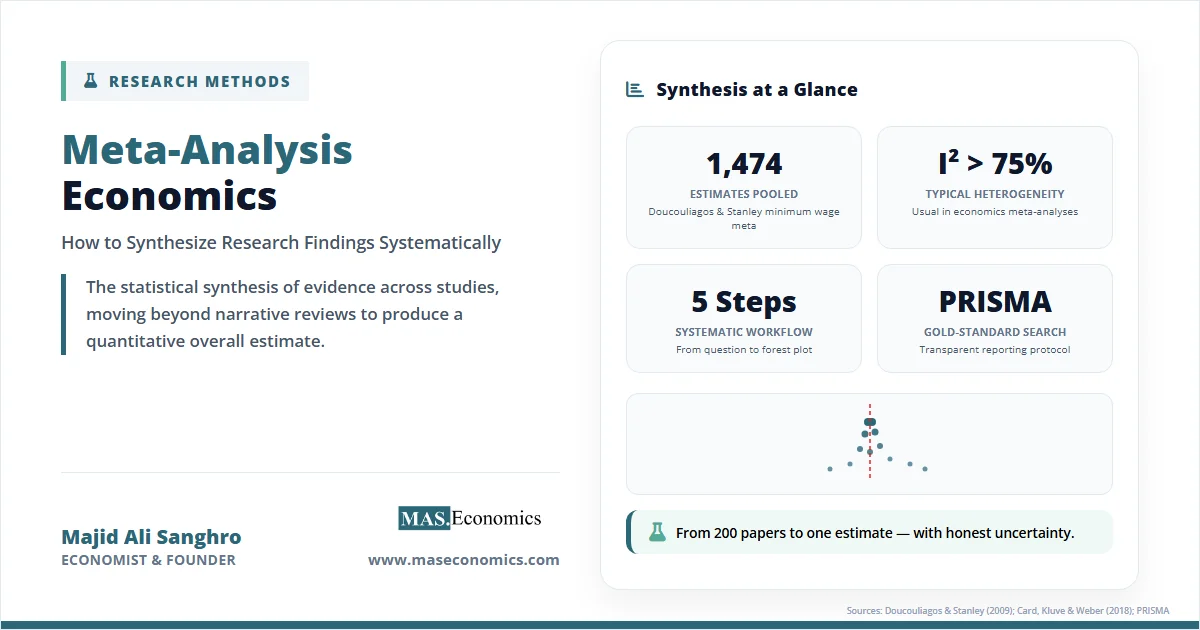
After more than 200 published studies on the minimum wage and employment, the overall effect on jobs remains contested. After hundreds of papers on whether immigration lowers native wages, where does the evidence actually settle? Meta-analysis economics exists to answer exactly these questions. It is the statistical synthesis of evidence across many studies, designed to produce a single quantitative estimate of an effect and to explain why individual studies disagree.
The traditional alternative is the narrative literature review: a researcher reads the papers, weighs them by judgment, and writes a summary. That approach is unreliable. Two reviewers reading the same fifty studies often reach different conclusions, and selective citation lets reviewers steer toward a preferred answer. Meta-analysis replaces judgment with arithmetic. Each study contributes a numeric effect size; those effects are weighted by precision, and the result is a pooled estimate with a confidence interval.
Meta-analysis also does something narrative reviews cannot. It can test whether the published literature is biased, measure how much studies disagree, and identify which study features predict the size of the effect. For policy, that matters: a finance minister who needs to know the fiscal multiplier, or a labour economist advising on minimum wage legislation, needs an honest estimate, not a pile of conflicting papers.
What Makes Meta-Analysis Matter
Three forces have pushed meta-analysis from a niche method to a core skill in applied economics. The first is the sheer volume of empirical work. Economics now produces tens of thousands of empirical papers a year, and on most policy-relevant questions, there are dozens of credible estimates pointing in different directions. A treasury official cannot read them all. A meta-analysis can.
The second force is the replication crisis, which has hit economics alongside psychology and medicine. Camerer and colleagues attempted to replicate eighteen experimental papers from top economics journals and reproduced the original direction and significance in roughly two-thirds of cases. That implies a third of headline findings may not survive a careful redo. When individual papers are unreliable, pooling many of them with explicit attention to bias becomes more useful, not less.
The third force is publication bias. Journals prefer statistically significant, novel results. Studies with null findings often sit in a “file drawer” and never get published. The published literature, therefore, overstates true effects, sometimes dramatically. Egger and colleagues showed that small studies in medicine systematically reported larger effects than large ones, a pattern now found across economic fields too. Meta-analysis offers tools to detect and correct for this distortion, which a narrative review cannot do.
For policy, the combined message is simple. Decisions about labour standards, monetary transmission, trade liberalisation, or aid effectiveness depend on quantitative answers. Pooling well, with attention to bias and disagreement, gets closer to the truth than any single paper, however well executed.
How Meta-Analysis Works
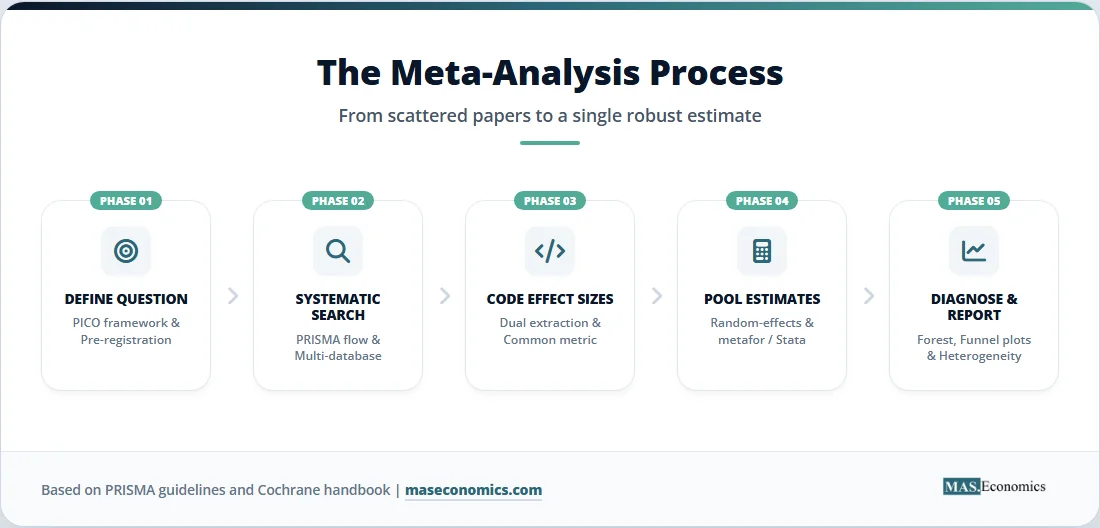
A meta-analysis runs through five disciplined steps. Each one has formal protocols and standard software, and each one has the power to make or break the final estimate.
Step 1: Define the Question
The research question must be precise enough that a coder can decide, for any given paper, whether it belongs in the sample. “Does the minimum wage reduce employment?” needs to be sharpened. Which workers? Teens, low-skill adults, restaurant employees? Which countries? What time horizon? The PICO framework, borrowed from medicine (Population, Intervention, Comparison, Outcome) translates well into economics. A clear protocol stops later cherry-picking.
Step 2: Search the Literature Systematically
The PRISMA guidelines are the standard for transparent reporting of systematic searches. The researcher specifies databases (EconLit, RePEc, Google Scholar, Web of Science), search strings, inclusion and exclusion criteria, and dates. The output is a flow diagram showing how thousands of initial hits are screened down to the final sample. Working papers and dissertations should be searched alongside published journals; excluding them tilts the sample toward published, significant results.
Step 3: Code Effect Sizes
Each study must be reduced to a comparable numeric estimate. Common effect-size metrics include elasticities, partial correlations, standardised mean differences, and odds ratios. The choice depends on the outcome. For minimum wage studies, the employment elasticity (percentage change in employment per one percent rise in the minimum wage) is standard. For cash-transfer programmes, the standardised mean difference between treatment and control groups is more typical.
Two coders should extract data independently and reconcile differences. Coding errors are the most common reason meta-analyses get challenged.
Step 4: Compute a Weighted Average
Effect sizes are pooled using inverse-variance weighting: estimates with smaller standard errors get more weight. The pooled effect under a fixed-effect model is
where \( \theta_i \) is the effect size from study \( i \), \( w_i = 1/v_i \) is the inverse of its variance, and \( k \) is the number of studies. The fixed-effect model assumes every study estimates the same true effect. The random-effects model relaxes that assumption, allowing the true effect to vary across studies because of differences in setting, period, or design. The weights become
where \( \tau^2 \) is the between-study variance, estimated from the data using methods such as DerSimonian-Laird or REML. In economics, the random-effects model is almost always more appropriate, because settings genuinely differ.
Step 5: Report and Interpret
The standard output is a forest plot: one line per study showing its effect and confidence interval, with the pooled estimate at the bottom. A funnel plot, heterogeneity statistics, and tests for publication bias accompany it.
| Step | What It Involves | Common Software |
|---|---|---|
| 1. Define question | PICO framework, written protocol, optional pre-registration on OSF or PROSPERO | None (planning document) |
| 2. Search literature | PRISMA flow, multi-database search, screening, deduplication | Rayyan, Covidence, EndNote |
| 3. Code effect sizes | Independent dual extraction, conversion to common metric, quality scoring | Excel, R (esc, compute.es), Stata (effsize) |
| 4. Pool estimates | Fixed and random-effects models, inverse-variance weights, sub-group analysis | R (metafor, meta), Stata (meta, metan), CMA |
| 5. Diagnose and report | Forest plot, funnel plot, Egger test, I² statistic, sensitivity analysis | R (metafor), Stata (meta funnelplot) |

|
||
Table 1. Workflow of a Meta-Analysis: Steps and Tools
Detecting Publication Bias
The “file drawer problem” is meta-analysis’s most stubborn enemy. If only significant results get published, the available literature is a biased sample of all research conducted. Rosenthal estimated that, for many psychology findings of his era, dozens of unpublished null studies would be needed to overturn the published consensus. In economics, Doucouliagos and Stanley found similar patterns across fields ranging from minimum wage research to the value of a statistical life.
The visual diagnostic is the funnel plot. Each study is plotted with its effect size on the horizontal axis and a measure of precision (usually the inverse standard error) on the vertical axis. In an unbiased literature, the plot should look like an inverted funnel: small, imprecise studies scatter widely at the bottom, large studies cluster tightly near the true effect at the top. Asymmetry, with small studies missing on one side, is the signature of publication bias.
Figure 1. Funnel plot illustrating publication bias in a hypothetical meta-analysis of minimum wage employment elasticities. Each point is a study; precision is on the vertical axis. The cluster on the right (negative employment effects) and the relative absence of small studies showing positive or near-zero effects on the left signal asymmetry consistent with selective publication. Pattern stylised after Doucouliagos and Stanley (2009).
Source: Author’s stylised illustration based on patterns documented in Doucouliagos & Stanley (2009), British Journal of Industrial Relations.
Beyond visual inspection, three formal tests are standard. Egger’s regression test regresses each study’s standardised effect on its precision; a significant intercept indicates funnel asymmetry. The trim-and-fill method, developed by Duval and Tweedie, estimates how many studies are “missing” from the funnel and imputes them, then recalculates the pooled effect. The PET-PEESE approach, popular in economics, regresses effect sizes on standard errors to estimate the true effect when bias is held constant; a non-zero intercept after that adjustment is interpreted as the bias-corrected estimate.
None of these tools is perfect. They can flag asymmetry that has nothing to do with publication bias, such as genuine heterogeneity correlated with study size. The honest researcher reports several diagnostics together and treats large discrepancies between adjusted and unadjusted estimates as a red flag rather than a verdict.
Heterogeneity and Why It Helps
Two studies of the same phenomenon rarely produce identical estimates. Some of that scatter is sampling noise; the rest is real heterogeneity, driven by differences in time, place, population, and method. Meta-analysis quantifies this with Cochran’s Q, a chi-square test of whether observed variation exceeds what sampling error alone would produce, and the I² statistic, which expresses the share of total variation that is genuinely between-study rather than within-study.
An \( I^2 \) of 0 means studies are essentially estimating the same number. Values around 25% are low, 50% moderate, and 75% or above high. In economics, \( I^2 \) above 75% is the norm, not the exception. Card, Kluve, and Weber’s meta-analysis of active labour market policies reported \( I^2 \) values consistently above 80% across outcome categories.
High heterogeneity is not a failure. It is information. The next step is moderator analysis: regressing study-level effect sizes on study characteristics to find out what drives the disagreement. In trade economics, meta-analyses of gravity models show that estimated trade-cost elasticities depend strongly on whether the study uses panel data, controls for multilateral resistance, or aggregates across product categories.
Two policy-relevant examples make the value clear. First, immigration. Card and Peri reviewed dozens of studies on whether immigration lowers native wages. Across the literature, the average effect is small and often near zero, but heterogeneity is high. Subgroup analysis shows the disagreement is mostly driven by methodological choices: studies using national-level “skill cell” approaches tend to find larger negative effects, while area-based studies find smaller ones. The pooled answer, then, is “small overall effect, with method-dependent variation,” which is far more informative than “the literature is mixed.”
Second, microcredit. The six-country randomised evaluation of microcredit coordinated by Banerjee, Karlan, and others found modest, positive effects on business activity but no transformative impact on income or consumption. Subsequent meta-analyses extended this to dozens of studies and confirmed the pattern: microcredit is useful at the margin, but it is not the poverty-killer once advertised. Heterogeneity here was a window into reality, not a problem to suppress.
Honest Critique of Meta-Analysis
Meta-analysis is not a machine that turns weak studies into strong evidence. The “garbage in, garbage out” critique applies in full force. If the underlying papers share a flawed identification strategy, pooling them produces a precise estimate of a biased number. Meta-analyses of cross-country growth regressions, for instance, often inherit the omitted-variable problems of the original literature, and the tightly estimated pooled coefficient gives a false sense of certainty.
The “apples and oranges” worry is also real. Pooling studies that measure subtly different outcomes, or that use different identification strategies, can mix results that should be kept separate. Best practice is to pre-specify subgroups, report stratified estimates, and let readers see the range rather than burying it in a single average.
A third concern is misuse. A meta-analysis can become a black box: a single number, decoupled from the underlying studies, used in policy debates as if it were a measurement. The corrective is transparency. Pre-registration of the meta-analysis protocol, including search terms, inclusion criteria, and analytic plan, is now standard in medicine and increasingly common in economics. The Open Science Framework and PROSPERO host such registrations. Sharing the full extracted dataset, with code, lets others replicate and extend the analysis, which is the foundation of good scientific practice.
Finally, meta-analysis cannot resolve fundamental theoretical disagreements. If economists disagree about whether to model the labour market as competitive or monopsonistic, the meta-analytic average of “minimum wage employment effects” will reflect that disagreement, not settle it. The technique synthesises evidence; it does not pick theories.
How to Read a Meta-Analysis
Most readers of meta-analyses are consumers, not producers. A working economist or policy analyst should be able to evaluate one in fifteen minutes. A short checklist helps.
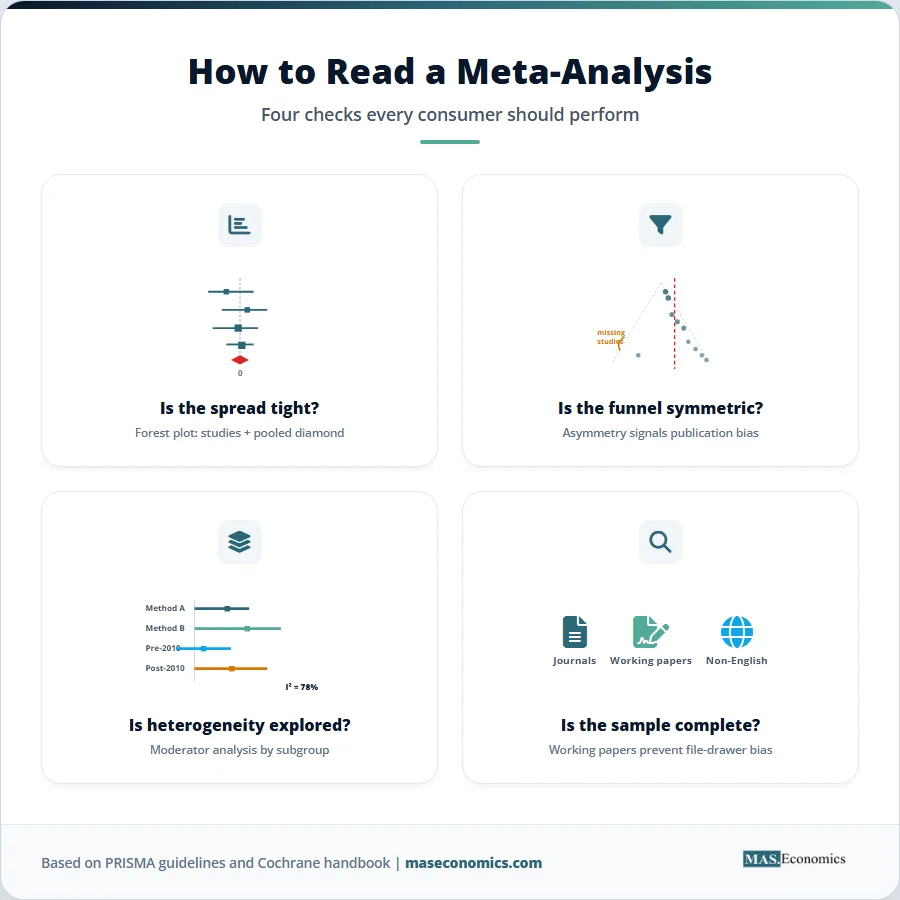
Start with the forest plot. Look at the spread of individual study estimates. Are they tightly clustered or spread across a wide range? Where does the pooled estimate sit, and how wide is its confidence interval? If the diamond at the bottom of the plot is narrow but the individual estimates above it span a huge range, the precision is illusory and reflects strong assumptions about between-study variance.
Next, check the funnel plot and bias tests. Is the funnel symmetric? Are Egger’s test and trim-and-fill results reported? If the bias-corrected estimate differs sharply from the headline estimate, weight the corrected one more heavily. If neither test is reported, treat the result with caution.
Then assess heterogeneity. Look for \( I^2 \) and the result of Cochran’s Q. If \( I^2 \) is high and no moderator analysis is reported, the single pooled estimate is hiding more than it reveals.
Finally, look at the sample of studies. Were working papers included or only published ones? Were non-English studies considered? Was a pre-registered protocol followed? A meta-analysis that draws only from the top-five economics journals is a meta-analysis of what those journals publish, which is not the same as a meta-analysis of the truth.
These four checks separate a meta-analysis you can cite from one you cannot.
Landmark Meta-Analyses in Economics
Several meta-analyses have shaped how economists think about long-running debates. The table below summarises a representative set.
| Topic | Studies | Overall Effect | Key Insight | Citation |
|---|---|---|---|---|
| Minimum wage and employment | 1,474 estimates from 64 studies | Average elasticity near zero after correcting for publication bias | Selective publication had inflated negative employment effects in the prior literature | Doucouliagos & Stanley (2009) |
| Active labour market programmes | 207 studies, >800 estimates | Modest positive effects; larger after two years; training works better than job search assistance | Programme type and time horizon explain most heterogeneity | Card, Kluve & Weber (2018, JEEA) |
| Immigration and native wages | ~30 reduced-form studies surveyed | Small effects on average; larger negatives for prior immigrants and low-skill natives | Method choice (skill-cell vs area-based) drives disagreement | Card & Peri (2016, JEL) |
| Microcredit impact | 7 randomised evaluations | Modest effects on business activity, near-zero on income or consumption | Microcredit is a useful tool, not a poverty cure | Meager (2019, AEJ: Applied) |
| Value of a statistical life | >100 studies | Mean VSL of roughly USD 9–11 million in US studies after bias correction | Strong publication bias in older literature; bias-corrected VSL is smaller | Doucouliagos, Stanley & Giles (2012) |
| Fiscal multipliers | >100 studies | Spending multipliers around 0.8–1.5 in recessions; smaller in expansions | Multiplier depends on the cycle and on monetary policy stance | Gechert (2015, Oxford Economic Papers) |
|
|
||||
Table 2. Selected Meta-Analyses That Reshaped Economic Debate
Each of these studies changed how policy questions were discussed. The minimum wage meta-analysis helped move the consensus toward “small or zero” employment effects. The microcredit pooling cooled enthusiasm in development circles. The fiscal multiplier work informed how finance ministries calibrated stimulus during and after the pandemic. None of the underlying papers, taken alone, would have shifted the debate as much.
MASEconomics Explains
Four economic concepts behind meta-analysis
Conclusion
Meta-analysis economics turns the chaos of conflicting empirical papers into a structured estimate of an effect, an honest map of disagreement, and a test of whether the published record is biased. It does not eliminate judgment, and it cannot save evidence built on weak identification. What it does is make the synthesis transparent: every study included, every effect size coded, every weight justified, every diagnostic reported.
For working economists, meta-analysis is becoming a basic skill rather than a specialty. Research training programmes increasingly include modules on it. For policy analysts, it offers something a single study cannot: a defensible single number, with known uncertainty, drawn from the full body of evidence. For readers, the four-step check (forest plot, funnel plot, heterogeneity, sample) is enough to tell a credible meta-analysis from a marketing exercise. Used well, the technique sharpens the link between hypothesis testing and policy decisions, and it makes economic research reporting more honest about what we collectively know.
Did you find this article helpful? Share it with someone who loves economics. And remember, at MASEconomics, we make complex ideas simple.