A regression table’s most informative numbers are the ones most readers skip. Confidence intervals report an estimate together with its uncertainty in one object, the range of parameter values compatible with the data at a stated standard, and they answer the question a decision-maker actually has: not merely whether an effect exists, but how large it might plausibly be and how large it might not. The starred coefficient that dominates attention is a compressed and lossy summary of the same information; the interval is the uncompressed version, and reading it well converts the same table into considerably more knowledge. The habit matters doubly because the interval’s correct interpretation is subtler than its popular one, and because the profession’s long argument over significance testing has ended, in practice, with a simple recommendation: report and read the range.
What the Range Is Built From
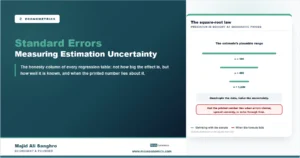
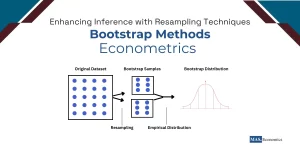
An interval is assembled from two ingredients the regression already produced. The point estimate marks the center: the single best guess from this sample. The standard error measures the sampling noise around it: how much the estimate would bounce from sample to sample if the study were rerun. A 95 percent interval then extends roughly two standard errors either side of the estimate, so its construction, familiar from any simple linear regression table, is nothing more exotic than estimate plus-or-minus twice its noise. Everything that corrupts the standard error corrupts the interval with it, which is why the diagnostics matter: error variance that changes across observations narrows or widens the honest range in ways the default formula misses, the problem treated in our article on heteroscedasticity, and serially correlated errors in time series routinely make reported intervals far too narrow, the trap covered in our guide to autocorrelation. When the textbook formulas cannot be trusted at all, the interval can be built empirically by resampling, the approach explained in our article on bootstrap methods.
The words “95 percent confidence” carry the subtlety. The probability statement describes the procedure, not the interval in front of you: a method with 95 percent coverage produces, across repeated samples, intervals that capture the true parameter 95 times in a hundred. Any single computed interval either contains the truth or does not, and no probability attaches to it directly; the confidence is in the machine, not the output. The distinction sounds pedantic until decisions depend on it, and readers who want the more natural statement, a 95 percent probability that the parameter lies in this range, are asking for a different construction with different inputs, the credible interval of Bayesian econometrics, which purchases the intuitive reading at the price of a prior.
The Interval and the Star Are One Machine
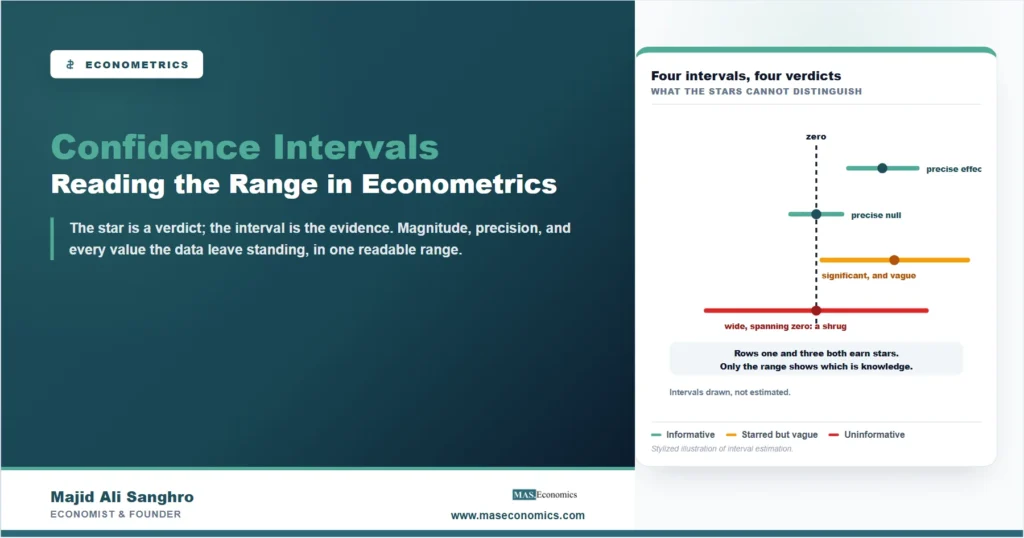
Significance testing and interval estimation are the same mathematics viewed from different ends: a coefficient is significant at the 5 percent level exactly when its 95 percent interval excludes zero, so every fact expressible in stars is readable off the range. The gain runs entirely in the other direction, because the interval reports so much the star discards. It shows magnitude, in the variable’s own units, which is where economic meaning lives. It shows precision: two coefficients with identical point estimates and identical stars can sit inside ranges of utterly different width, one nailing the effect to a narrow band, the other compatible with anything from negligible to enormous, and the formal testing framework laid out in our guide to hypothesis testing cannot see that difference. And it dignifies the informative null: a tight interval hugging zero is a genuine empirical finding, the demonstration that any effect is at most small, where the same result reported as “insignificant” reads as failure. Wide intervals deliver the complementary honesty, that the data cannot distinguish trivial from transformative, a verdict worth having before anyone acts on the point estimate.
Reading Rules for the Working Economist
Four habits extract most of the interval’s value. Read both endpoints economically: ask what the world looks like if the truth sits at the bottom of the range, and at the top, and whether the decision at hand changes across that span; if it does not, the estimate is precise enough to act on, whatever its p-value. Treat width as the finding when it is: an interval spanning trivial-to-enormous is a result about the data’s informativeness, and saying so is better science than leaning on the point estimate. Distrust beautiful narrowness in settings where the standard errors are suspect, since an interval built on wrong noise inherits the error at full strength; the diagnostics above are the checklist. And resist the residual habit of collapsing the range back into a binary at zero, which spends the interval’s entire information advantage to recover the star it was meant to replace. The range is the honest shape of what one sample knows; the skill is letting it stay a range.
MASEconomics Explains
3 economic concepts behind confidence intervals
These concepts are explored in depth across our educational articles library.
Explore the MASEconomics BlogConclusion
Confidence intervals are the regression table’s fullest sentence: a point estimate, its precision, and the whole set of parameter values the data leave standing, delivered in the units the economics is conducted in. Their formal interpretation is a property of the procedure, coverage across repeated samples rather than a probability pinned to any one range, and their integrity is exactly as good as the standard errors beneath them. Neither caveat diminishes the practical point: everything the significance star reports is visible in the interval, and most of what the interval reports is invisible in the star.
The reading discipline is short. Take the endpoints seriously as economic scenarios, let width itself be a finding, audit the standard errors before admiring the narrowness, and decline the invitation to collapse the range back into a verdict at zero. An empirical literature that argued for decades about significance thresholds has converged on advice that fits in one line, and it is the line this article exists to explain: report the range, and then actually read it.
Frequently Asked Questions
What does a 95 percent confidence interval mean?
It is the range of parameter values compatible with the data, built as the estimate plus and minus roughly two standard errors. The 95 percent refers to the procedure: across repeated samples, intervals constructed this way would contain the true value 95 percent of the time. It is a statement about the method’s reliability, not about any single interval.
Is there a 95 percent probability the true value lies inside the interval?
Strictly, no: in the classical framework the true parameter is fixed and a computed interval either contains it or does not, so the probability attaches to the procedure’s long-run coverage rather than to one range. The statement people want to make is licensed by Bayesian credible intervals, which require specifying prior beliefs to earn it.
How are confidence intervals related to statistical significance?
They are the same test in different clothing: a coefficient is significant at the 5 percent level exactly when its 95 percent interval excludes zero. The interval simply reports more, showing the magnitude and the precision of the estimate alongside the yes-or-no fact the star compresses everything into.
Why do many economists prefer intervals to p-values?
Because decisions turn on magnitudes and uncertainty, which intervals display and p-values discard. An interval distinguishes a precisely measured effect from a vaguely measured one with the same significance, elevates the informative null from failure to finding, and reveals when data are simply too weak to guide action, none of which a p-value can express.
What makes a confidence interval narrow?
Lower sampling noise: more observations, more variation in the regressor, less residual variance, and correctly computed standard errors. Narrowness is only a virtue when the standard errors are honest; heteroscedasticity or autocorrelation can produce intervals that are impressively tight and wrong, which is why the diagnostics come before the admiration.
Thanks for reading! The star is a verdict; the interval is the evidence, and evidence is the better read. Happy learning with MASEconomics