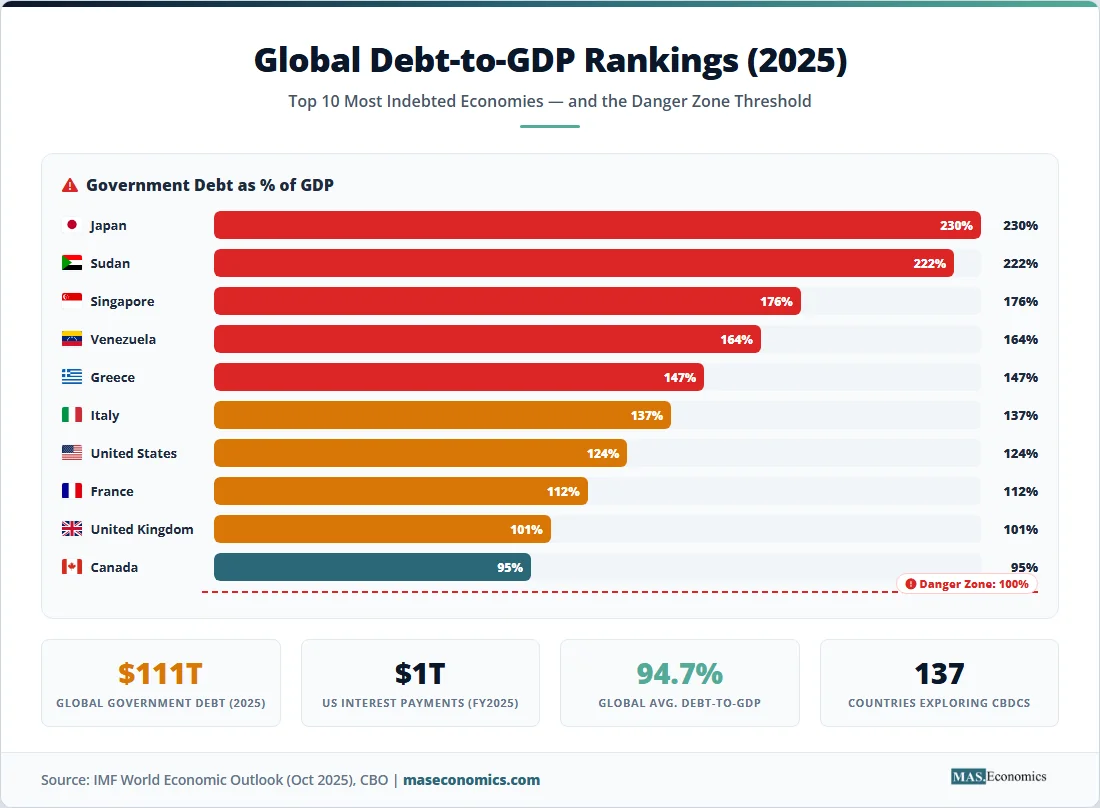
Sovereign debt sustainability is the central fiscal question of the 2020s. Global government debt reached $111 trillion in 2025, more than five times the $19.7 trillion recorded in 2000. The United States now spends more on interest payments than on national defence. Japan carries a debt burden exceeding 230% of GDP. The United Kingdom, France, and Italy are running deficits that show no signs of closing. And the era of near-zero interest rates that made all of this borrowing painless is over.
Let’s explore what sovereign debt sustainability actually means, why it matters more now than at any point since the Second World War, which economies face the greatest risks, and how the interplay of interest rates, growth, and demographics determines whether a government can keep borrowing or is heading toward a fiscal crisis.
The Scale of the Problem
The trajectory of global public debt follows a pattern of staircase increases, with each crisis ratcheting the level permanently higher.
Between 2000 and 2007, total public debt grew modestly from $19.7 trillion to $35.8 trillion, roughly in line with global GDP growth. The 2008 financial crisis triggered a sharp jump as governments bailed out banks and launched stimulus programmes, pushing debt to $45.5 trillion by 2009. A decade of low interest rates then allowed governments to sustain higher debt loads without immediate fiscal pressure, as borrowing costs remained below economic growth rates. By 2019, global debt had drifted to $73.9 trillion.
Then came COVID-19. In a single year, global government debt surged from $73.9 trillion to $84.9 trillion, the largest one-year increase on record. Governments around the world borrowed massively to fund lockdown support, healthcare spending, and economic stimulus. The assumption was that this was temporary emergency spending that would be wound down once the pandemic ended.
It was not. By 2025, global debt had climbed to $111 trillion. The IMF’s World Economic Outlook estimated the global debt-to-GDP ratio at 94.7%, up from 92.4% the previous year. Among advanced economies, the average stood near 113% of GDP. And unlike the post-2008 period, the interest rate environment has fundamentally changed. Central banks raised rates aggressively to combat inflation in 2022 and 2023, and while some easing has occurred, borrowing costs remain well above the near-zero levels that prevailed from 2009 to 2021.
What Sovereign Debt Sustainability Actually Means
A government’s debt is considered sustainable when it can meet its current and future payment obligations without requiring extraordinary measures such as default, hyperinflation, or politically impossible fiscal adjustments. The concept rests on a straightforward relationship between four variables: the existing debt level, the interest rate the government pays on that debt, the rate of economic growth, and the primary budget balance (government revenues minus spending, excluding interest payments).
The core equation of debt sustainability can be expressed as:
where \( \Delta d \) is the change in the debt-to-GDP ratio, \( r \) is the real interest rate on government debt, \( g \) is the real GDP growth rate, \( d_{t-1} \) is the existing debt-to-GDP ratio, and \( pb \) is the primary balance as a share of GDP.
When the interest rate exceeds the growth rate (\( r > g \)), debt automatically grows relative to GDP unless the government runs a primary surplus large enough to offset the difference. When growth exceeds the interest rate (\( g > r \)), governments can stabilize or reduce their debt ratios even while running moderate primary deficits. This is precisely what happened during the 2010s, when near-zero interest rates and positive (if modest) growth allowed most advanced economies to sustain high debt levels without fiscal crises.
The shift from \( g > r \) to \( r > g \) that occurred in 2022 and 2023, as central banks raised rates to fight inflation, fundamentally changed the arithmetic. Governments that had grown comfortable borrowing at 1% to 2% now face interest costs of 4% to 5%, while growth in many advanced economies has slowed to below 2%. The gap between \( r \) and \( g \) has flipped, and the consequences are already visible.
The United States: Interest Payments Surpass Defence Spending
The United States presents the most consequential case of sovereign debt sustainability risk, not because its fiscal position is the worst in relative terms, but because of its sheer scale and its central role in global financial markets.
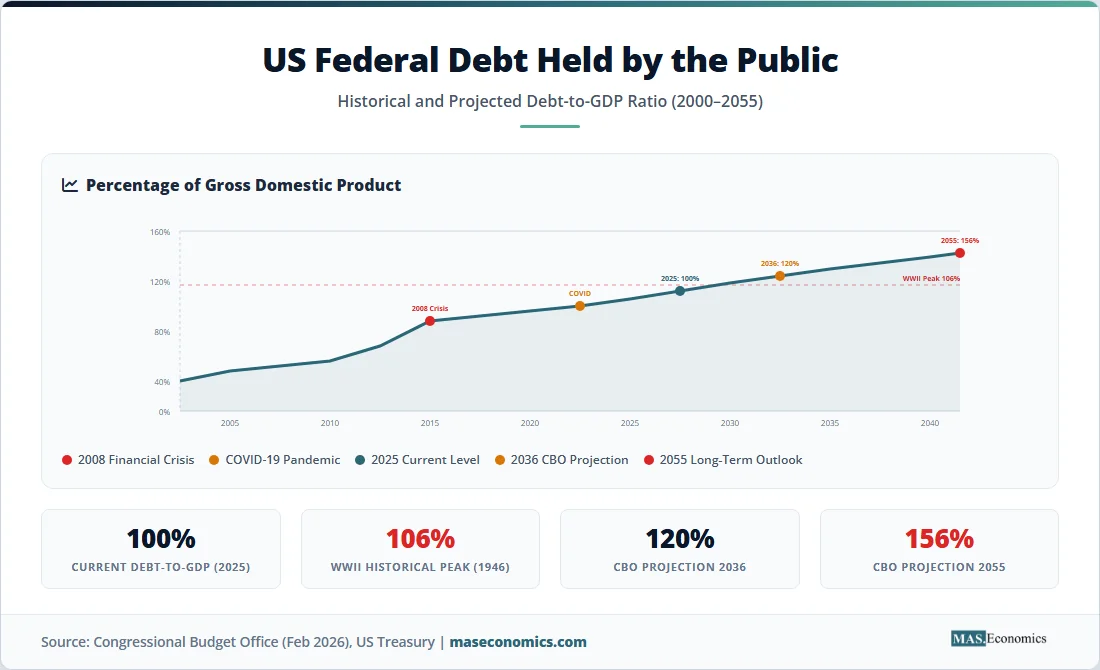
Federal debt held by the public reached $30.3 trillion at the end of fiscal year 2025, equivalent to 100% of GDP. The Congressional Budget Office projects this will rise to 120% of GDP by 2036, surpassing the previous record of 106% set in 1946 at the end of the Second World War.
The interest bill tells the story most clearly. The US government spent $1 trillion on interest payments in fiscal year 2025, making net interest the second-largest government expenditure, behind only Social Security. This was $79 billion more than the $949 billion spent in fiscal year 2024. Interest costs now exceed spending on Medicare, national defence, Medicaid, veterans’ benefits, transportation, and science combined.
The CBO projects that interest payments will surpass $1 trillion in FY2026 and double to $2.1 trillion by FY2036, making debt service the fastest-growing category of federal spending. Over the next decade, cumulative interest payments are projected to total $16.2 trillion. Each additional percentage point of interest rates adds roughly $300 billion per year to the federal borrowing cost.
The Committee for a Responsible Federal Budget estimated that under an alternative scenario where temporary tax provisions are made permanent and tariff revenues are reduced by court rulings, debt could reach 134% of GDP by 2035 and interest payments could consume over $2 trillion annually.
| Country | Debt-to-GDP (2025) | Interest Cost (% of GDP) | Primary Balance | Key Risk Factor |
|---|---|---|---|---|
| Japan | 230% | ~1.5% | Deficit | Aging population, BoJ rate normalization |
| United States | 124% | 3.2% | Deficit (5.9% of GDP) | Rising interest costs, political gridlock |
| Italy | 137% | ~3.8% | Near balance | Low growth, ECB bond purchase exit |
| France | 112% | ~1.9% | Deficit | Political instability, EU fiscal rules |
| United Kingdom | 101% | ~3.1% | Deficit | Inflation-linked gilts, low growth |
| Greece | 147% | ~2.5% | Surplus | Legacy debt, but improving trajectory |

|
||||
Japan: The 230% Outlier
Japan’s debt-to-GDP ratio of 230% dwarfs every other advanced economy. By conventional measures, Japan should have experienced a fiscal crisis decades ago. It has not, and understanding why illuminates the limits of simple debt-to-GDP comparisons.
Japan’s debt is overwhelmingly domestically held. Over 80% is owned by Japanese institutions: the Bank of Japan, commercial banks, insurance companies, and pension funds. Foreign investors hold less than 15%. This domestic ownership structure insulates Japan from the kind of sudden capital flight that triggered crises in Greece, Argentina, and other countries. Japanese savers, for cultural and structural reasons, continue to purchase government bonds even at minimal yields.
The Bank of Japan held interest rates near zero for most of the past two decades, keeping debt service costs remarkably low despite the enormous debt stock. The average maturity of Japanese government bonds exceeds 9.5 years, meaning that higher rates only gradually feed through to increased borrowing costs.
However, the BoJ’s gradual normalization of monetary policy, with rates rising to 0.75% in 2026, introduces a new variable. Even a modest increase in Japan’s average borrowing cost, compounded by a debt stock exceeding $10 trillion, generates substantial additional fiscal pressure. Combined with the most rapidly aging population among major economies and rising social security costs, Japan’s fiscal trajectory requires close monitoring.
The European Debt Landscape
Europe’s sovereign debt picture is fragmented. Italy (137% of GDP) and Greece (147%) carry the heaviest burdens, while Germany (~63%) and the Netherlands (~46%) maintain relatively conservative positions. France, at 112%, has recently emerged as a source of concern after political instability disrupted fiscal consolidation plans.
The European Central Bank’s exit from its pandemic-era bond purchase programmes has removed a key source of demand for peripheral European government bonds. During the crisis years, the ECB effectively acted as a backstop buyer, suppressing yields on Italian, Spanish, and Greek debt. As that support is withdrawn through quantitative tightening, spreads between German and Italian bond yields could widen, increasing borrowing costs for the most indebted members of the eurozone.
The EU’s revised fiscal rules, which came into effect in 2024, require member states with debt above 60% of GDP to reduce their debt ratios by an average of 1 percentage point per year. Several countries, including France and Italy, face politically difficult choices between compliance with these rules and domestic spending demands, particularly on defence and energy infrastructure.
Why Sovereign Debt Sustainability Matters Now More Than Before
The Interest Rate Regime Has Changed
The single most important shift is the end of the low-interest-rate era. Between 2009 and 2021, the \( r – g \) differential was negative in most advanced economies: governments could borrow at rates below their economic growth rates, making debt naturally self-reducing as a share of GDP. The post-pandemic inflation surge and aggressive monetary policy tightening reversed this. In the United States, the average effective interest rate on federal debt is now climbing as older, low-coupon bonds mature and are refinanced at higher rates. The CBO projects that the average interest rate on federal debt will rise from 3.2% in 2025 to over 4% by the mid-2030s.
Demographic Pressures Are Accelerating
Aging populations in every major advanced economy are increasing mandatory spending on pensions, healthcare, and social services. In the United States, Social Security and Medicare alone account for roughly 40% of federal outlays. In Japan, social security costs consume over 30% of the national budget. In the EU, the old-age dependency ratio is projected to nearly double by 2060. These expenditures are politically almost impossible to cut, creating a structural floor under government spending that makes fiscal consolidation exceptionally difficult.
Fiscal Buffers Are Depleted
Perhaps most concerning is that the capacity to respond to future crises has been diminished. When COVID-19 struck, governments could borrow trillions at near-zero rates. The next recession, financial crisis, or geopolitical shock will arrive at a time when debt levels are already at or near historical records, interest rates are substantially higher, and fiscal space is constrained. The ability of governments to deploy counter-cyclical fiscal stimulus in the next downturn may be significantly limited.
The Emerging Market Divergence
Sovereign debt sustainability is not exclusively an advanced economy problem, but the dynamics differ sharply across the developing world.
Commodity-exporting emerging markets have generally improved their fiscal positions during the 2022 to 2025 commodity price cycle. Brazil has stabilized its debt-to-GDP ratio near 75%. Saudi Arabia maintains net creditor status. Indonesia demonstrates exemplary fiscal discipline at roughly 40% of GDP.
By contrast, commodity-importing developing economies face a triple squeeze: higher import costs (particularly for energy and food), rising dollar-denominated debt service costs as the US dollar strengthened, and reduced access to international capital markets as global investors demand higher risk premiums. Several low-income countries, including Zambia, Sri Lanka, and Ghana, have already entered formal debt restructuring processes.
The divergence highlights a critical point about sovereign borrowing: what matters is not just the level of debt but the currency composition, the ownership structure, the maturity profile, and the capacity to generate the economic growth needed to service it.
Source: IMF World Economic Outlook (October 2025), CBO (February 2026), AMRO (April 2025) | MASEconomics.com
The horizontal bar chart ranks major economies by their 2025 debt-to-GDP ratios. Red bars indicate countries above 130% of GDP (Japan, Greece, Italy), amber bars indicate countries in the 100 to 130% range (the United States, France, the United Kingdom), and teal bars represent those below 100%. The dashed line at 100% marks the threshold beyond which the IMF considers debt servicing to begin significantly crowding out productive investment.
Can They Keep Borrowing? Three Scenarios
Scenario 1: Gradual Normalization (Base Case)
Interest rates settle at 3 to 4%, growth remains moderate at 1.5 to 2%, and governments make incremental adjustments to primary balances. Debt-to-GDP ratios continue to rise slowly in the US, Japan, and parts of Europe, but no acute crisis occurs. This is roughly the CBO’s baseline projection: US debt reaching 120% of GDP by 2036. Sustainable, but with progressively less room for manoeuvre.
Scenario 2: Growth Surprise (Optimistic)
A productivity breakthrough, perhaps driven by AI adoption reaching its “harvest phase” as discussed in the AI productivity debate, lifts growth rates above interest rates for a sustained period. Combined with nominal GDP growth boosted by moderate inflation (2 to 3%), this would naturally reduce debt-to-GDP ratios without requiring painful spending cuts. Historical precedent exists: the United States reduced its debt-to-GDP ratio from 106% in 1946 to 24% by 1974 primarily through sustained economic growth, not through austerity.
Scenario 3: Fiscal Crisis (Adverse)
A geopolitical shock, a recession that triggers a new round of emergency borrowing, or a loss of market confidence in a major sovereign borrower pushes interest rates sharply higher. Under the CRFB’s alternative scenario, US debt could reach 134% of GDP by 2035 with annual interest payments exceeding $2 trillion. A similar dynamic in Italy, without ECB backstop support, could reignite eurozone sovereign debt concerns. Japan faces the most extreme version of this risk if the BoJ loses control of its yield curve management.
MASEconomics Explains
Four concepts behind the sovereign debt sustainability debate
Sovereign Debt Sustainability
A government’s ability to meet its current and future debt obligations without resorting to default, hyperinflation, or extraordinary fiscal adjustments. Sustainability depends on the interplay of four variables: the debt level, the interest rate, the growth rate, and the primary budget balance.
The r minus g Framework
The difference between the real interest rate on government debt (r) and the real GDP growth rate (g). When r exceeds g, debt ratios rise automatically unless offset by primary surpluses. The shift from negative to positive r minus g in 2022 to 2023 ended the era of “free borrowing” for advanced economies.
Primary Balance
Government revenues minus government expenditures, excluding interest payments on existing debt. A primary surplus means the government collects more in taxes than it spends on programmes. This surplus can be used to pay down debt. Most advanced economies currently run primary deficits, meaning debt would grow even if interest rates were zero.
Fiscal Space
The gap between a government’s current debt level and the theoretical maximum it could sustain without losing market confidence. Countries with ample fiscal space (such as Germany or Australia) can respond aggressively to crises. Countries with depleted fiscal space (such as Italy or the US) face constrained options when the next downturn arrives.
Conclusion
Sovereign debt sustainability has shifted from an abstract academic concept to the defining fiscal challenge of the current decade. Global government debt at $111 trillion, US interest payments exceeding $1 trillion annually, Japan at 230% of GDP, and the end of the low-rate era that made this borrowing painless: these are not future risks. They are current realities.
The arithmetic is unforgiving. When interest rates exceed growth rates, debt ratios rise automatically unless governments generate primary surpluses. Most advanced economies are doing the opposite, running large primary deficits driven by aging populations, rising healthcare costs, and defence commitments. The CBO projects US debt reaching 156% of GDP by 2055 under current law, with interest payments consuming a larger share of federal revenue than at any point in the nation’s history.
History provides both reassurance and warning. The United States successfully grew its way out of post-war debt levels through sustained economic expansion. But it has never attempted to do so, starting from debt levels this high, with demographics this unfavourable, and with interest rates this far above the near-zero floor that prevailed for the previous decade. The question of sovereign debt sustainability is, at its foundation, a question about whether economic growth can outrun the cost of past borrowing. The data so far suggests the race is getting harder.
Did you find this article helpful? Share it with someone who loves economics. And remember, at MASEconomics, we make complex ideas simple.