Inflation simply explained: the sustained increase in the general price level of goods and services in an economy, measured by indices that track how much more a representative basket of items costs today than it did in a base period. US headline CPI inflation accelerated to 3.8 percent year-on-year in April 2026, the highest reading since May 2023, after the disinflation from a 9.1 percent peak in June 2022 had brought it to 2.3 percent in early 2025, according to the Bureau of Labor Statistics. The euro area followed an almost identical path: HICP inflation rose to 3.0 percent in April 2026 from 2.6 percent in March, with energy alone climbing 10.9 percent year-on-year on Middle East supply concerns, per the Eurostat HICP flash estimate.
The Mathematics of a Price Level Change
Inflation is a rate of change, not a level. The standard inflation rate compares the current value of a price index to its value one period earlier, scaled to a percentage:
Here \( \pi_t \) is the inflation rate in period \( t \), \( P_t \) is the price index in period \( t \), and \( P_{t-1} \) is the price index one period earlier. When \( t \) is a month and \( t-1 \) is the same month a year ago, the result is the year-on-year inflation rate quoted in BLS releases. When \( t-1 \) is the previous month, it is the month-on-month rate. The price index itself is a weighted average of category prices:
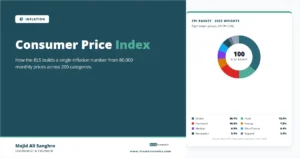
The weights \( w_i \) sum to 100 and represent each category’s share of the basket. For the US CPI, shelter alone carries a weight of nearly 36 percent, food roughly 14 percent, and energy about 7 percent, per the BLS Relative Importance tables. The arithmetic looks straightforward, but the choice of basket, the frequency of weight updates, and the treatment of new or improved goods are where the measurement disputes live. The consumer price index profile covers those mechanics in depth.
Four Mechanisms Behind Rising Prices
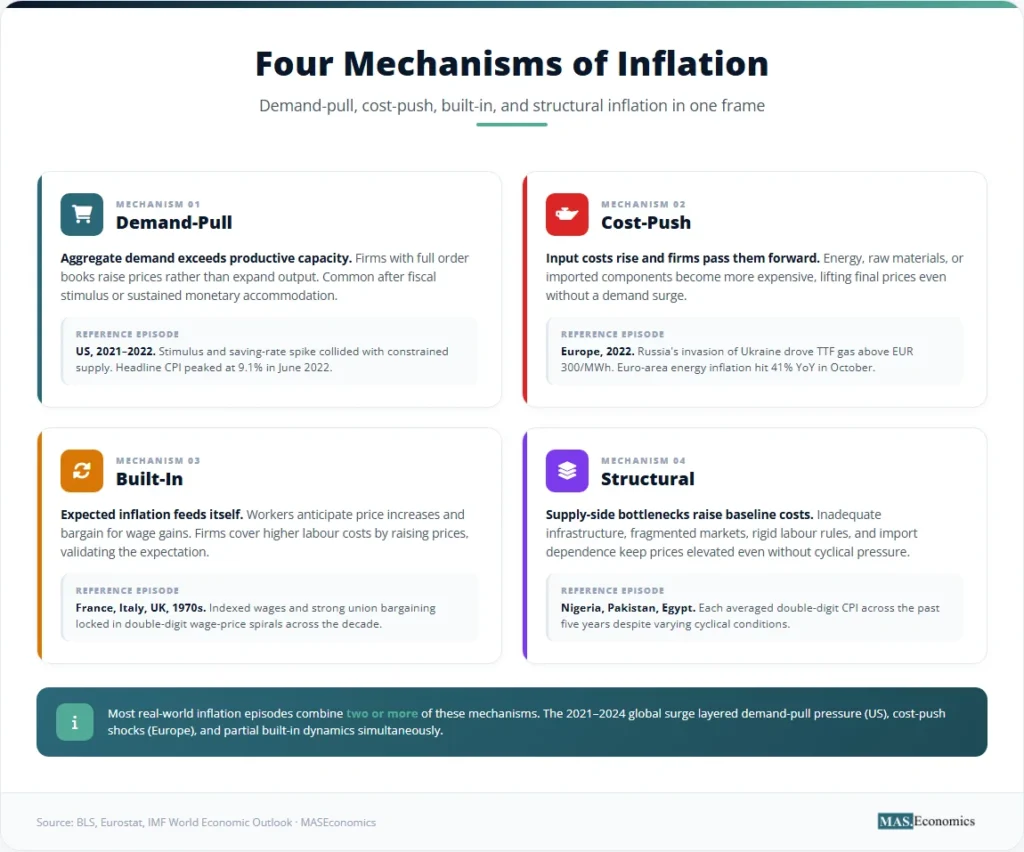
Economists have identified several types of inflation that operate through distinct channels. The four canonical mechanisms are demand-pull, cost-push, built-in, and structural inflation.
Demand-Pull Inflation
Demand-pull inflation occurs when aggregate demand for goods and services outstrips the productive capacity of the economy. Firms respond to excess demand by raising prices rather than expanding output. The post-pandemic US recovery is a textbook case. Personal saving rates spiked to 32 percent in April 2020, household balance sheets absorbed roughly USD 2.3 trillion in stimulus payments, and as supply chains rewired, the resulting demand wave collided with constrained capacity. By June 2022, headline CPI hit 9.1 percent, the highest reading since November 1981, according to the FRED CPIAUCSL series.
Cost-Push Inflation
Cost-push inflation arises when the cost of production rises and firms pass the burden forward through higher final prices. The 1973 OPEC oil embargo quadrupled crude prices within a year and produced double-digit CPI readings across the OECD. A similar pattern reappeared in 2022, when Russia’s invasion of Ukraine pushed Brent crude above USD 120 per barrel and TTF natural gas above EUR 300 per megawatt-hour. European inflation absorbed the shock first, with energy inflation reaching 41 percent year-on-year in October 2022, per Eurostat HICP data.
Built-In Inflation
Built-in inflation is the wage-price interaction. When workers anticipate price increases, they bargain for compensating wage gains. Firms facing higher labour costs raise output prices to protect margins, validating the original expectation. The mechanism depends on backward-looking expectation formation and the bargaining power of labour. It featured prominently in the 1970s wage-price spirals across France, Italy, and the United Kingdom, and the question of whether the 2022-2024 episode would repeat that pattern dominated central bank communications throughout the cycle.
Structural Inflation
Structural inflation reflects persistent supply-side bottlenecks. Inadequate infrastructure, fragmented markets, rigid labour regulations, and import dependence keep production costs elevated even in the absence of cyclical demand pressure. Emerging economies often run baseline inflation rates several points above advanced-economy averages for these structural reasons. Nigeria, Pakistan, and Egypt have each averaged double-digit CPI readings across the past five years despite varying cyclical conditions, per IMF World Economic Outlook data.
From CPI to PCE: Three Measurement Tools
Three indices dominate practical inflation measurement: the Consumer Price Index, the GDP deflator, and the Personal Consumption Expenditures price index. Each captures a different slice of the price-change problem.
Consumer Price Index
The Consumer Price Index tracks the average price change of a fixed basket of goods and services purchased by urban households. The BLS surveys approximately 80,000 prices each month across 23,000 retail outlets in 75 urban areas, releasing the headline number around the middle of the following month. The arithmetic compresses to a single index level relative to a 1982-1984 base of 100. The April 2026 CPI level near 320 means that the basket costs roughly 3.2 times what it cost in the base period.
The CPI has known limitations. It uses a Laspeyres-type fixed-basket formula that does not fully account for substitution when relative prices change. It also struggles to incorporate quality improvements in new goods. The BLS publishes a chained CPI (C-CPI-U) to address substitution bias, and the BEA’s PCE index uses a chain-weighted formula natively for the same reason.
GDP Deflator
The GDP deflator is the ratio of nominal GDP to real GDP, multiplied by 100. Unlike the CPI, it covers every good and service produced domestically rather than a household-consumption basket. It includes investment goods, government services, and exports, and excludes imported consumer goods. Its scope makes it more comprehensive but also less timely, since it is released quarterly with the GDP report and revised multiple times.
PCE Price Index
The Personal Consumption Expenditures price index, published by the BEA, is the Federal Reserve’s preferred inflation gauge. It uses a chain-weighted formula that updates basket weights frequently and applies a broader scope than the CPI: it captures spending made on behalf of households, such as employer-provided health insurance and Medicare reimbursements. The Fed targets 2 percent on the PCE measure, not the CPI, a distinction codified in its 2020 Statement on Longer-Run Goals.
The PCE has consistently run 0.3 to 0.5 percentage points below CPI inflation over the past two decades, a wedge driven by methodology differences. Core PCE, which strips out food and energy, is the variable the FOMC watches most closely when calibrating policy.
Headline and Core Inflation Across 25 Years
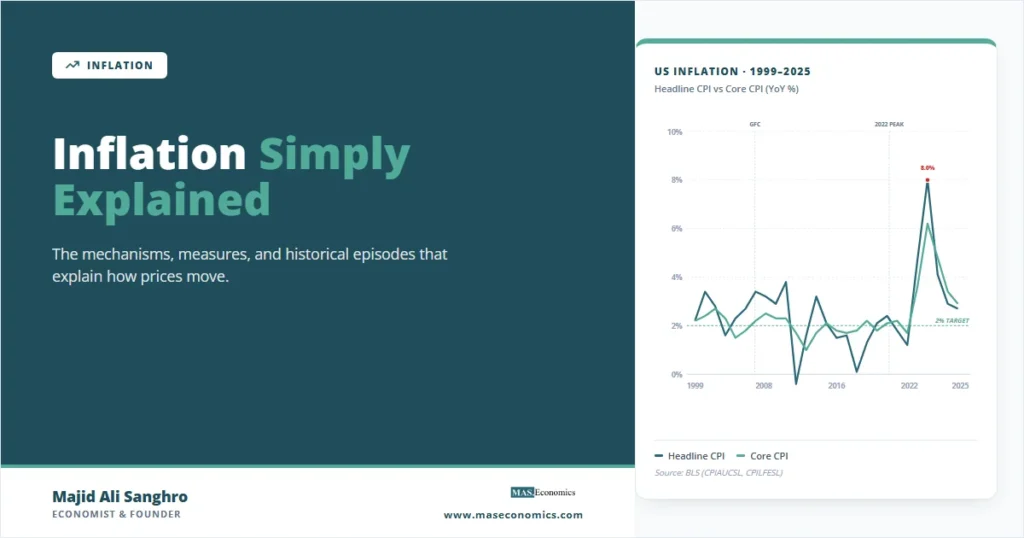
The interaction between headline and core inflation is the single most important pattern in modern inflation dynamics. Headline inflation captures everything in the basket and is volatile because food and energy prices swing sharply with weather, geopolitics, and commodity cycles. Core inflation excludes food and energy and is the cleaner signal of underlying price pressure. The chart below tracks both for the United States across the 1999-2025 span, covering the dot-com slowdown, the 2008 financial crisis, the 2015-2016 commodity bust, the 2020 pandemic, and the 2021-2024 inflation surge.
Three patterns stand out across the chart. First, core inflation is far less volatile than headline inflation: the standard deviation of core across the 27 years is roughly 1.2 percentage points, versus 1.9 for headline. Second, the headline overshoots core during energy-driven episodes (2008, 2011, 2022) and undershoots during energy busts (2009, 2015). Third, core inflation moved decisively above the Fed’s 2 percent target only twice in this window: briefly in 2006-2008 and substantially during the 2021-2024 surge. The persistence of the 2021-2024 deviation, particularly in services ex-shelter, is what justified the Fed’s 525 basis points of cumulative tightening between March 2022 and July 2023.
The April 2026 print added a fourth pattern to that list. Headline CPI re-accelerated to 3.8 percent while core CPI held at 2.8 percent, a wedge of one full percentage point opened almost entirely by energy. Gasoline rose 28.4 percent year-on-year and the energy index gained 17.9 percent, on Middle East-related supply concerns. The episode shows that even well into a disinflation, the headline-core gap can swing sharply on a single supply shock without underlying inflation pressure changing direction. Markets responded by pricing in roughly a 30 percent probability of a Fed rate hike by year-end 2026, according to CME Group fed funds futures.
Creeping, Walking, Running, and Galloping Inflation
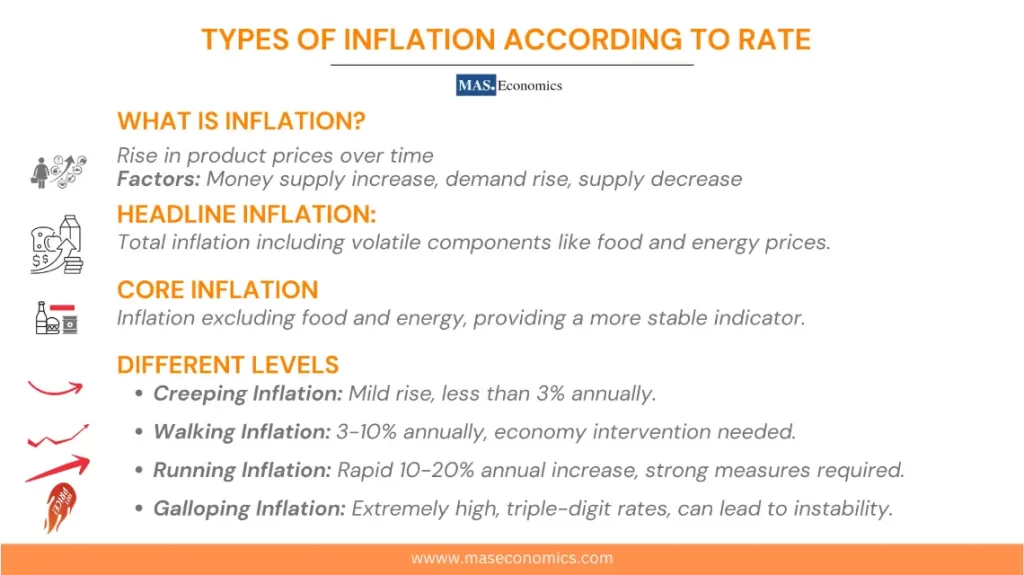
Inflation regimes are typically categorised by their annual rate. Creeping inflation runs below 3 percent and is the regime that advanced economies generally aim for. Walking inflation sits between 3 and 10 percent; many emerging economies have lived in this band for sustained periods. Running inflation, between 10 and 20 percent, signals serious macroeconomic stress. Galloping inflation exceeds 20 percent annually. Argentina ended 2024 with year-on-year inflation above 200 percent, and Turkey’s CPI breached 75 percent in May 2024, per the IMF World Economic Outlook database.
Five Centuries of Notable Inflation Episodes
The historical record contains episodes that illuminate every mechanism above. The table below summarises seven of the most studied, from the German hyperinflation of 1923 to the 2021-2024 post-pandemic surge. The pattern is informative: hyperinflations are almost always rooted in fiscal dominance and monetary financing of deficits, while the more common moderate inflations reflect oil shocks, demand booms, or policy missteps.
| Period | Episode | Peak Inflation | Primary Driver | Policy Response | Outcome |
|---|---|---|---|---|---|
| 1921–1923 | Weimar Germany | 29,500% (Oct 1923, monthly) | Monetary financing of reparations | Rentenmark currency reform | Currency destroyed; new mark anchored |
| 1973–1975 | First oil shock | 12.3% (US, 1974) | OPEC embargo, supply shock | Accommodative, then late tightening | Inflation entrenched |
| 1978–1982 | Second oil shock, Volcker disinflation | 14.8% (US, 1980) | Energy + wage-price spiral | Fed Funds rate to 19% under Volcker | Inflation broken at recession cost |
| 1990–1994 | Brazil (Plano Real precursor) | 2,477% (1993) | Fiscal indexation, money financing | Plano Real stabilisation (1994) | Stabilised below 10% by 1997 |
| 2007–2009 | Zimbabwe hyperinflation | 79.6 billion % (Nov 2008, monthly) | Money printing, agricultural collapse | Currency abandonment, dollarisation | Z$ destroyed; foreign currency adopted |
| 2016–2019 | Venezuela hyperinflation | 130,060% (2018, annual) | Oil collapse, fiscal dominance | Currency redenomination (2018, 2021) | Partial dollarisation |
| 2021–2024 | Post-pandemic global surge | 9.1% (US, Jun 2022) 10.6% (EU, Oct 2022) |
Demand-supply mismatch + energy | Cumulative 525 bp Fed, 450 bp ECB | Disinflation by 2024; soft landing |

|
|||||
Three regularities cut across these episodes. Hyperinflations always involve a fiscal authority unable or unwilling to finance itself through taxation, monetary issuance covering the gap, and a central bank without operational independence. Moderate inflation surges, by contrast, can resolve without currency destruction when the central bank tightens credibly, and the underlying shock dissipates. The hyperinflation case studies dossier explores the first category at length, and the 1970s Great Inflation piece documents the second.
From Price Index to Real Economy
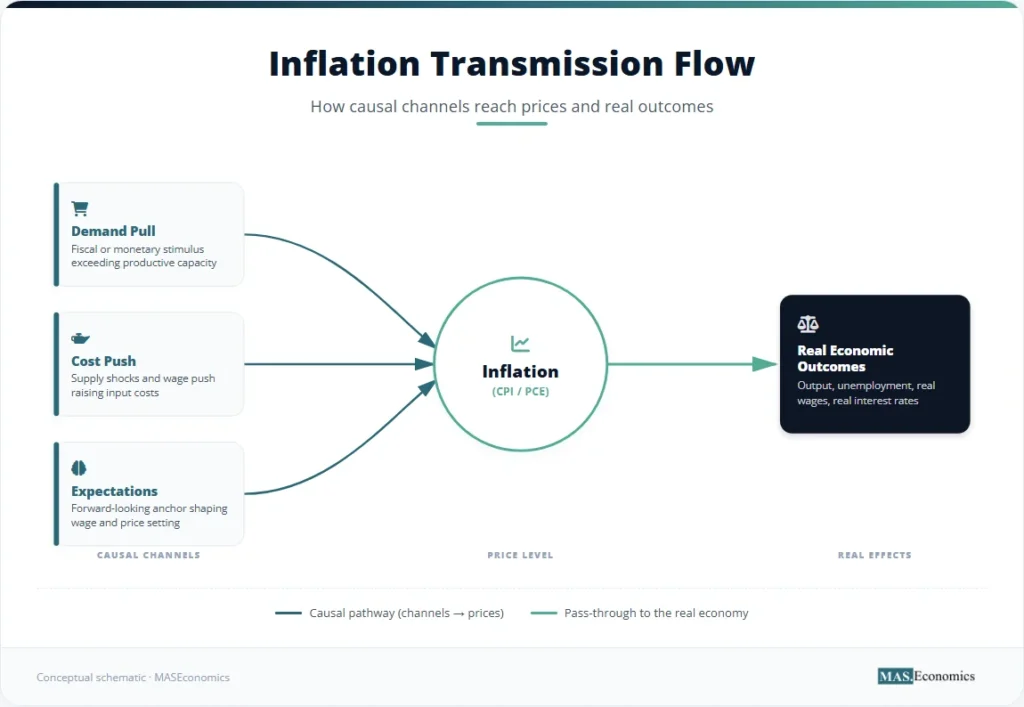
The four mechanisms above describe what drives inflation; they do not exhaust how inflation propagates through the economy once it is underway. Modern inflation models compress the demand-pull and cost-push channels into a single category labelled supply-demand pressure, separate out the role of inflation expectations as an independent transmission channel, and treat structural inflation as a baseline condition that shifts the level around which the cyclical channels operate. The diagram below shows the three transmission channels feeding into the headline price indices and from there into real outcomes such as output, unemployment, and real interest rates.
Why Inflation Helps Some and Hurts Others
Inflation is not distributionally neutral. Moderate inflation can grease wage and price adjustment, erode the real value of nominal debt, and provide central banks with room to cut rates below zero in real terms during downturns. These benefits are real and account for why the Fed and ECB target 2 percent rather than 0 percent.
The costs, however, fall unevenly. Households on fixed nominal incomes (retirees, low-income workers without indexed wages) lose real purchasing power immediately. Holders of long-duration nominal bonds suffer capital losses as expected inflation rises and yields adjust. Borrowers with long-term fixed-rate debt gain at the expense of their creditors. The distributional incidence of inflation depends heavily on each household’s exposure to housing, food, and energy, the share of income from wages versus fixed transfers, and access to inflation-protected savings instruments. Lower-income deciles devote a larger share of spending to food and energy, which is why headline inflation tends to hit them harder than the CPI averages suggest.
Menu Costs, Shoe-Leather Costs, and Other Frictions
The textbook costs of inflation fall into two buckets: those associated with expected inflation, and those triggered by unexpected inflation.
Expected inflation produces menu costs (the resources firms expend on repricing goods, updating labels, reprogramming vending machines, and online catalogues), shoe-leather costs (households economising on cash holdings by visiting banks or ATMs more frequently, a costly activity when cash earns no interest), and tax distortions (bracket creep, where nominal income gains push taxpayers into higher marginal rates without any real income increase). The purchasing-power erosion across commodities is the most visible of these frictions for everyday households.
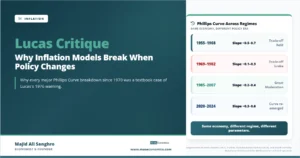
Unexpected inflation imposes higher costs. It redistributes wealth arbitrarily between creditors and debtors, increases uncertainty premiums in long-term contracts, and can cause firms to misread relative-price signals. A surge of CPI from 2 to 6 percent confuses the question of whether a category-specific price increase reflects rising demand for that good or simply the general price drift. This signal-extraction problem, formalised by Robert Lucas in 1973, is part of why central banks invest so heavily in anchoring inflation expectations.
Hyperinflation: When Money Loses Meaning
Hyperinflation is conventionally defined, following economist Philip Cagan, as a regime in which monthly inflation exceeds 50 percent, which compounds to roughly 12,875 percent annually. The defining feature is not the headline rate itself but the breakdown of money’s three functions: as a unit of account (prices change too fast to quote), as a medium of exchange (sellers switch to dollars, euros, or barter), and as a store of value (cash holdings are abandoned within hours of receipt).
Zimbabwe in 2008 is the clearest modern example. Government deficits had been monetised through the Reserve Bank of Zimbabwe for years, and a collapse of the agricultural sector following the post-2000 land reform programme accelerated the fiscal gap. By November 2008, monthly inflation reached an estimated 79.6 percent, with prices doubling every 24.7 hours. The Zimbabwean dollar was formally abandoned in 2009. The Weimar legacy remains the most consequential historical case because it shaped a century of German monetary doctrine and ultimately the architecture of the ECB.
Stagflation: Inflation Without Growth
Stagflation describes the rare combination of high inflation, slow growth, and rising unemployment. It was supposed to be impossible under the original Phillips Curve framework, which posited a stable trade-off between inflation and unemployment. The 1970s broke that framework. From 1973 to 1975, the US ran simultaneous CPI inflation above 9 percent and unemployment above 8 percent. The Phillips Curve was reformulated by Friedman and Phelps to incorporate expectations, restoring theoretical coherence and shifting policy doctrine toward inflation targeting.
Concerns about a stagflation return surfaced again in 2022 when energy prices spiked alongside falling real wages, but the actual outcome diverged sharply. Unemployment in the US stayed below 4.5 percent throughout the 2022-2024 disinflation, and core PCE returned toward 2 percent without a recession. Whether the post-2024 disinflation qualifies as a soft landing or a delayed adjustment is still being debated in the Fed system, but the stagflation analogy has largely been retired.
Inflation, Disinflation, and Deflation
Three related terms cause persistent confusion. Inflation is a sustained increase in the general price level. Disinflation is a decline in the inflation rate that remains positive: prices are still rising, but more slowly. The global disinflation from 8 percent in 2022 to roughly 3 percent in 2024 is the largest and fastest such episode in four decades. Deflation, by contrast, is a sustained decline in the price level itself, where the year-on-year inflation rate is negative.
Deflation sounds beneficial for consumers, but it creates severe macroeconomic problems. The real value of debt rises as prices fall, increasing the burden on borrowers. Consumers may defer purchases in anticipation of further declines, suppressing aggregate demand. Profit margins compress, leading to layoffs and further demand weakness. Japan’s experience from 1995 through 2013, when CPI inflation averaged near zero and occasionally negative, is the textbook cautionary tale and the reason the Bank of Japan maintained yield-curve control and negative policy rates for much of that period. The contemporary debate over sticky services inflation and the greedflation question illustrates how the disinflation phase generates its own analytical disputes.
MASEconomics Explains
Four economic concepts behind inflation
These concepts are explored in depth across our educational articles library.
Explore the MASEconomics BlogConclusion
Inflation simply explained is the sustained rise in the general price level of goods and services, measured by price indices and driven by some combination of demand pressure, cost shocks, expectations, and structural supply constraints. The headline rate is what households feel at the till; the core rate is what central banks target. The CPI is the most widely cited gauge in the United States; the PCE price index is the Fed’s preferred measure, and the GDP deflator captures the broadest scope of domestic production. Across two centuries of recorded episodes, the regularity is clear: moderate inflation is manageable with credible monetary policy, while hyperinflation requires the fiscal authority to lose control of its own balance sheet. The 2021-2024 surge tested every part of that framework, and the policy response has so far validated the institutional architecture built after the 1970s.
Frequently Asked Questions
What is inflation in simple terms?
Inflation is the rate at which the average price of goods and services rises over time. When the inflation rate is 3 percent per year, a basket that cost USD 100 a year ago now costs USD 103, and the same dollar buys 3 percent fewer goods than before. It is measured by indices such as the Consumer Price Index and the PCE price index.
What causes inflation?
Four mechanisms drive inflation: demand-pull (aggregate demand exceeds productive capacity), cost-push (input costs such as oil or labour rise and firms pass them on), built-in (expected inflation feeds into wage and price decisions), and structural (persistent supply-side bottlenecks). Most real-world episodes combine two or more of these channels.
How is inflation measured?
The most common measures are the Consumer Price Index (CPI), the Personal Consumption Expenditures price index (PCE), and the GDP deflator. The CPI tracks a fixed basket of household purchases; the PCE captures broader household consumption and is the Fed’s preferred gauge; the GDP deflator covers every good and service produced domestically. Each is reported as a year-on-year or month-on-month percentage change.
What is the difference between inflation, disinflation, and deflation?
Inflation is a sustained rise in the price level. Disinflation is a fall in the inflation rate that stays positive, meaning prices are still rising but more slowly. Deflation is a sustained fall in the price level itself, with a negative year-on-year inflation rate. Japan experienced prolonged near-zero or mild deflation between 1995 and 2013.
Why do central banks target 2 percent inflation?
A small positive inflation rate gives central banks room to cut real interest rates below zero in downturns, allows relative price adjustment without nominal wage cuts, and provides a buffer against deflation, which is harder to escape. The 2 percent figure was first formalised by the Reserve Bank of New Zealand in 1990 and has since been adopted by the Fed, ECB, Bank of England, and most major central banks.
Thanks for reading! If you found this helpful, share it with friends and spread the knowledge. Happy learning with MASEconomics