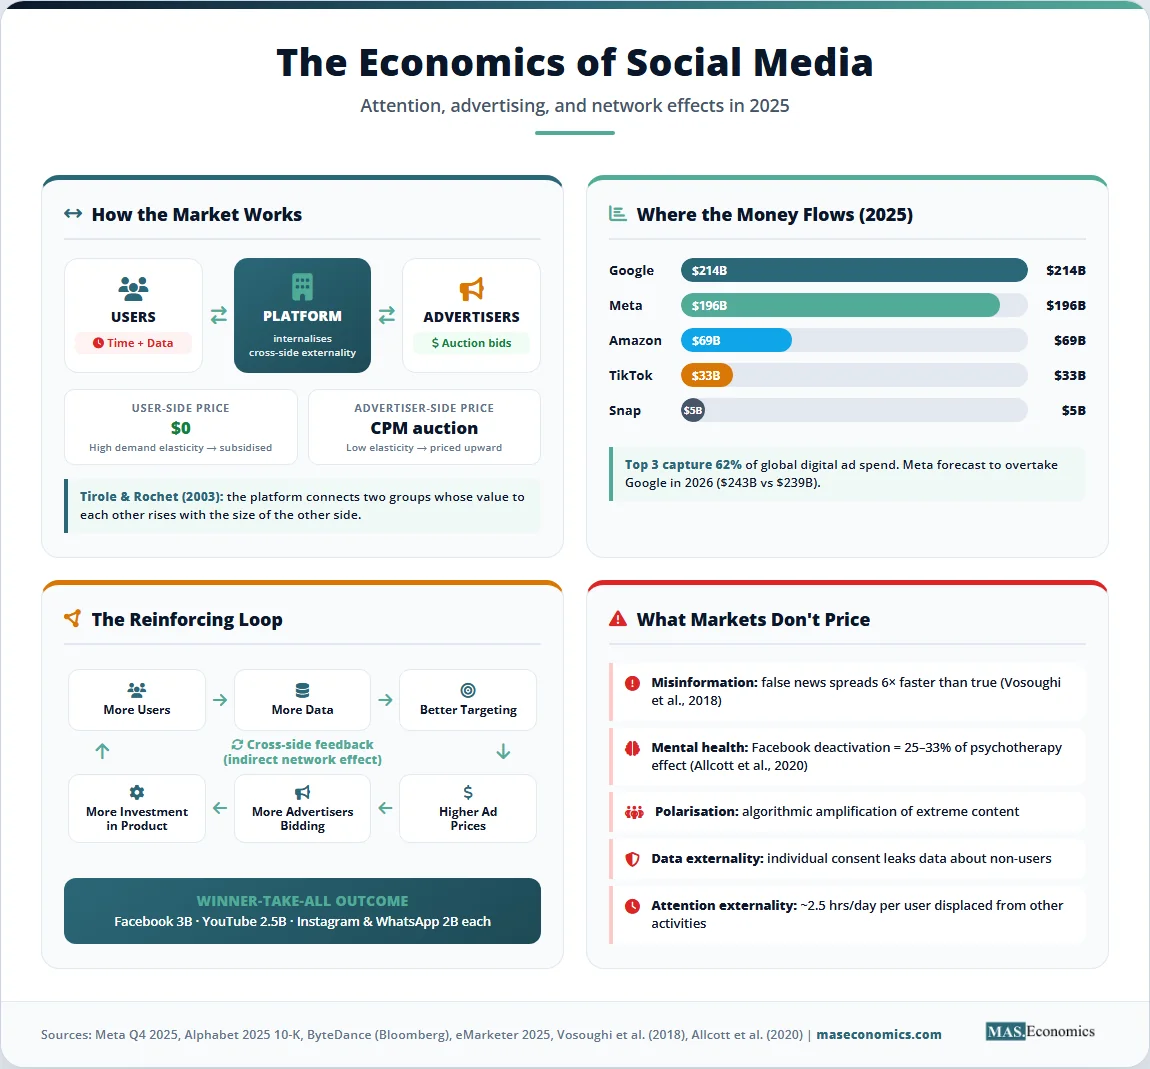
Meta earned roughly $196 billion in advertising revenue in 2025 without charging users a subscription fee. Alphabet earned over $214 billion, and ByteDance is on track for $50 billion in net profit. The economics of social media rests on a paradox: users pay nothing in cash, yet the global digital advertising market crossed $650 billion in 2025. Someone is paying. Something is being sold.
Free social media is not free. The product is not the platform. The product is the user, packaged as attention and behavioural data, then auctioned to advertisers in milliseconds. The price shows up elsewhere: in time spent scrolling, in personal data harvested at scale, in market structures that crush competitors, and in social costs ranging from teenage anxiety to election misinformation. Understanding how this works requires four ideas economists have been refining since the 1990s: two-sided markets, network effects, attention as a scarce resource, and externalities that escape the price system.
The Numbers Behind the Free Lunch
Meta’s 2025 financials tell the story bluntly. According to the company’s fourth-quarter earnings release, advertising revenue grew 22.1% year-over-year to $196.18 billion, accounting for 97.6% of total revenues. Family of Apps’ daily active users averaged 3.58 billion, meaning each user generated roughly $54 in annual advertising revenue. In the United States, the figure exceeds $200 per user.
Alphabet’s annual revenue topped $400 billion for the first time in 2025, with YouTube’s annual revenue surpassing $60 billion, as CEO Sundar Pichai disclosed on the February 2026 earnings call. ByteDance hit roughly $186 billion in revenue and $50 billion in profit, according to Bloomberg. TikTok’s global ad revenue alone reached about $33 billion in 2025, growing 40% year-on-year.
The pattern is consistent. Every major social platform converts user time into advertiser cash. Each minute of scrolling generates impressions, clicks, and behavioural signals that feed targeting algorithms. The more users, the more data, the better the targeting, the higher the price advertisers pay. Free is the input. Advertising is the output. Attention is the conversion mechanism.
The Attention Economy
Social media platforms are a textbook example of two-sided markets, a structure economists Jean Tirole and Jean-Charles Rochet formalised in their 2003 paper on platform competition. A two-sided market connects two distinct groups whose value to each other depends on the size of the other group. On one side: users, who want content, connection, and entertainment. On the other side: advertisers, who want access to those users’ attention.
The platform’s core economic function is to internalise the externalities between the two sides. Users do not directly pay advertisers, and advertisers do not directly pay users. The platform sits in the middle, prices each side strategically, and captures the value created by the connection. Tirole won the 2014 Nobel Prize in Economics partly for this work, and the framework has shaped competition policy ever since.
What users pay is not money. They pay with two scarce resources. The first is time, increasingly the binding constraint on advertiser revenue. According to Pew Research and Statista, the average American spends over 2 hours and 30 minutes per day on social media. TikTok users in some markets spend over 90 minutes daily on the app alone. The second is data: every like, share, dwell time, location ping, and contact list upload becomes a feature in machine learning models that predict purchasing behaviour.
The economist Herbert Simon framed the underlying scarcity in 1971: a wealth of information creates a poverty of attention. Total human attention is roughly fixed. There are 24 hours in a day, and only some fraction is available for advertising exposure. Platforms compete fiercely for each minute. The “engagement” metric that drives product design is, in economic terms, market share of the attention economy.
Pricing on the user side is typically zero, sometimes even negative when platforms pay creators. Pricing on the advertiser side is determined by auction. The result is a market where the side with higher elasticity of demand (users) is subsidised, and the side with lower elasticity (advertisers chasing scarce attention) is taxed. This pricing logic, common across credit cards, video games, and operating systems, is the central insight of two-sided market theory.
Network Effects and Winner-Take-All
Why are there only three or four global social networks instead of three hundred? The answer is network effects. A network effect means a product becomes more valuable as more people use it. Telephones, fax machines, and credit cards work the same way. Social media works the same way, only more so.
Two types of network effects operate at once. Direct network effects mean each new user makes the platform more valuable to other users: more friends to follow, more content to consume, more conversations to join. Indirect network effects work across the two sides of the market: more users attract more advertisers, which fund better products, which attract more users. The loop reinforces itself.
Mathematically, if utility for each user grows roughly with the number of other users, total platform value scales nonlinearly with size. Sarnoff’s law gives linear scaling. Metcalfe’s law gives quadratic scaling. Reed’s law gives exponential scaling for group-forming networks. The exact functional form is debated, but the qualitative point is robust: bigger platforms are not just bigger, they are disproportionately more valuable.
This dynamic creates natural monopoly tendencies, similar to those discussed in classic oligopoly analysis. Once a platform crosses a critical mass, switching costs lock in users. A new social network might be technically superior, but if your friends, family, and followers are all on Instagram, the cost of leaving exceeds the benefit of switching. Economists call this a coordination problem. Game theory predicts that markets with strong network effects tend toward winner-take-all or winner-take-most outcomes.
The data confirms the prediction. Facebook has 3 billion monthly active users. YouTube has roughly 2.5 billion. WhatsApp and Instagram each have 2 billion. TikTok has crossed 1.5 billion. The long tail of smaller platforms shares a tiny remainder. Platform economics generally favours concentration, and social media is the purest case.
The Advertising Model
The mechanism that turns attention into money is the targeted ad auction. When a user opens Instagram or scrolls TikTok, the platform runs a real-time auction, often in under 100 milliseconds, to decide which ad to show. Advertisers bid based on expected return: how likely is this specific user to click, install, or buy?
The auction format is typically a generalised second-price auction or, increasingly, a variant calibrated for predicted outcomes. The economics of these auctions trace back to William Vickrey’s 1961 work on truthful bidding mechanisms, and more directly to the auction theory developed for spectrum sales in the 1990s. The platform’s revenue is the sum of winning bids; each bid reflects how valuable that user’s attention is to that advertiser at that moment.
Targeting precision determines bid prices. The more a platform knows about a user, age, location, browsing history, purchase behaviour, friends, interests, the more precisely advertisers can predict outcomes, the more they will pay. Data brokers like Acxiom and LiveRamp historically supplied additional signals, fusing offline purchase data with online identifiers to enrich targeting. The entire system runs on identifiers, mostly cookies on the open web and device IDs on mobile.
This is where Apple’s App Tracking Transparency framework, introduced in iOS 14.5 in April 2021, hit the social media business model directly. ATT requires apps to obtain explicit user consent before tracking activity across other apps and websites. Most users say no. According to industry estimates, only 25% of US users opt in to tracking.
The economic impact has been measurable. Meta disclosed in early 2022 that ATT would cost roughly $10 billion in lost revenue that year, and analysts estimate the cumulative cost to Meta alone exceeded $13 billion through 2022. A Financial Times analysis found that Meta, YouTube, Twitter, and Snap collectively lost around $10 billion in revenue from ATT changes. Snap’s market value fell more than 25% in a single day in October 2021 partly because of ATT effects. The change demonstrated that user data is not a free input. When access is restricted, ad prices fall, revenue compresses, and the entire valuation of the sector adjusts.
Google’s planned phase-out of third-party cookies in Chrome, repeatedly delayed, points the same direction. Each tightening of the data flow forces platforms to invest in alternative signals, contextual targeting, and on-device modelling. The economic shift is from third-party data collection toward first-party data and platform-owned closed ecosystems. The companies with the most user time and the most diverse signals (Meta, Google, Amazon, ByteDance) are best positioned to absorb the shock.
Market Structure and Moats
Social media is an oligopoly with very high barriers to entry. The structure can be analysed using the standard tools of market structure: concentration ratios, sunk costs, switching costs, and strategic entry deterrence.
The four-firm concentration ratio in global social media advertising is striking. According to eMarketer’s late-2025 forecast, Meta and Google together held roughly 53% of worldwide digital ad spending in 2025; with Amazon added, the top three exceeded 60%. Meta is forecast to surpass Google in global ad revenue in 2026, with $243 billion against Google’s $239 billion. The remaining 37% is split across TikTok, Microsoft, Snap, X, Reddit, and the long tail of programmatic open web inventory.
Barriers to entry are extreme. New entrants face three layers of moat. The first is the network effect already described: a platform with no users has no value. The second is data advantage: incumbents have years of behavioural data that no startup can replicate. The third is capital intensity: Meta’s 2025 capital expenditure exceeded $40 billion, much of it for AI infrastructure to power ad ranking. A challenger needs not just users and data, but the compute to train competitive recommendation models.
Incumbents reinforce these moats through copycat acquisitions and feature replication. Facebook acquired Instagram in 2012 for $1 billion and WhatsApp in 2014 for $19 billion, both deals later scrutinised by competition authorities. When Snapchat introduced Stories in 2013, Instagram launched an identical feature in 2016 and overtook Snap within a year. When TikTok grew, Meta launched Instagram Reels and YouTube launched Shorts. The pattern is consistent: dominant platforms either buy or copy successful innovations, denying entrants the chance to scale.
Decentralised alternatives exist but remain marginal. Mastodon, built on the open ActivityPub protocol, claims a few million active users, a rounding error against Meta’s 3 billion. Bluesky, launched in 2023 with backing from Twitter co-founder Jack Dorsey, crossed 30 million users by late 2025. These platforms address valid concerns about content moderation and platform power, but the same network effects that protect incumbents also slow decentralised rivals. Network effects are symmetric: they help whoever crosses critical mass first.
Externalities and Market Failures
The clean two-sided market story leaves out the costs that fall on third parties. These are externalities, classic market failures that the price system fails to internalise. Social media generates several of them, and the academic evidence has grown substantial.
The first is misinformation. Algorithms optimised for engagement reward content that triggers strong emotional responses. False or misleading content often performs better than accurate content, because outrage and surprise drive sharing. A landmark 2018 Science study by Vosoughi, Roy, and Aral found that false news on Twitter spreads roughly six times faster than true news, particularly for political content. The platform earns ad revenue from both. The cost of polluted public discourse is borne by society.
The second is mental health, especially among adolescents. The work of Allcott, Braghieri, Eichmeyer, and Gentzkow, published in the American Economic Review in 2020, used a randomised experiment to estimate that deactivating Facebook for four weeks improved subjective well-being by an amount equivalent to between a quarter and a third of the effect of psychotherapy. Subsequent studies of Instagram and TikTok have found similar patterns, with stronger effects for teenage girls. The platform internalises the engagement; the user bears the well-being cost.
The third is political polarisation. Recommendation algorithms create filter bubbles and amplify extreme content because extreme content is engaging. Whether this hardens existing views or exposes users to opposing views is debated; recent work by Guess et al. (2023) using Facebook’s own data found that algorithmic feed changes had limited short-term effects on attitudes, but the broader question of cumulative effect on democratic discourse remains open.
The fourth is what privacy economists call the data externality. When one user shares contacts, location, or behaviour, they reveal information about other people, including non-users. A user who uploads their address book exposes the contact information of friends who never consented. A user whose purchase history reveals pregnancy status exposes patterns that affect other women in similar demographics. Acquisti, Taylor, and Wagman summarise this literature in their Journal of Economic Literature survey (2016). Individual privacy choices have collective consequences, and individual consent does not solve the externality.
The fifth is the attention externality. Time spent on social media is time not spent on something else: family, exercise, work, or sleep. Aggregated across billions of users, the welfare loss is large but invisible in any market price. The platform optimises for engagement, not for user welfare or social welfare. This is closely related to the data economics framework that treats personal data as a non-rival resource with significant spillover effects.
The Regulatory Response
Regulators have begun to respond. The European Union’s Digital Services Act, in full force since February 2024, imposes obligations on Very Large Online Platforms with more than 45 million EU users. Requirements include transparent content moderation, risk assessments for systemic harms, restrictions on advertising to minors, and bans on targeted advertising based on sensitive data such as religion or sexual orientation. Penalties can reach 6% of global annual turnover, a credible threat against Meta or Google.
The Digital Markets Act, a parallel EU regulation, designates “gatekeepers” and imposes ex ante rules on self-preferencing, interoperability, and data portability. Apple, Google, Meta, Amazon, ByteDance, and Microsoft are all designated gatekeepers. Several DMA enforcement cases are now active, with potential fines that could reshape platform business models.
In the United States, the regulatory picture is more fragmented. The Kids Online Safety Act (KOSA), introduced in the Senate and reintroduced multiple times, would impose a duty of care on platforms to prevent harms to minors. As of early 2026, KOSA has not yet passed Congress, with debate continuing over First Amendment and enforcement concerns. Several states, including California, New York, and Utah, have enacted their own youth safety laws, leading to a patchwork of state-level requirements.
Antitrust enforcement is also active. The US Federal Trade Commission’s case against Meta, alleging illegal monopolisation through the Instagram and WhatsApp acquisitions, went to trial in 2025. The Department of Justice won its case against Google’s search monopoly in 2024, with remedies still being decided. These cases test whether existing antitrust frameworks can address modern platform concentration.
The economic question underneath the regulatory debate is straightforward: how should the gains from network effects be distributed between platforms, users, advertisers, and society? Network effects create real consumer surplus, free communication and entertainment for billions, but they also produce concentrated market power and uncompensated externalities. The policy challenge is to preserve the surplus while curbing the abuse.
Platform Revenue at a Glance
The table below summarises the economic structure of the major social and digital ad platforms based on their 2025 disclosures and industry estimates. The pattern is consistent: scale, ad-funded model, and concentration in the hands of a few firms.
| Platform | Parent | 2025 Ad Revenue | Monthly Active Users | Primary Ad Format | ARPU (Annual) |
|---|---|---|---|---|---|
| Facebook + Instagram + WhatsApp | Meta Platforms | $196.2 bn | ~3.98 bn (Family of Apps) | Feed and Stories ads, Reels | ~$54 |
| YouTube | Alphabet | ~$60 bn | ~2.5 bn | Pre-roll, mid-roll, Shorts | ~$24 |
| TikTok (ex-China) | ByteDance | ~$33 bn | ~1.6 bn | In-feed video, branded effects | ~$21 |
| X (Twitter) | X Corp | ~$3 bn | ~600 m | Promoted posts | ~$5 |
| Snapchat | Snap Inc. | ~$5 bn | ~850 m | Snap Ads, Spotlight | ~$6 |
| Microsoft | ~$5 bn (ads) | ~1 bn members | Sponsored content, InMail | ~$5 | |
| Reddit Inc. | ~$1.6 bn | ~110 m DAU | Promoted posts | ~$15 | |
 | |||||
Sources: Company earnings reports (Meta Q4 2025, Alphabet Q4 2025), eMarketer 2025 forecast, Business of Apps platform reports, Sensor Tower 2025 estimates. Figures rounded; smaller platforms estimated where official data is unavailable.
Digital Ad Revenue by Platform
The chart below shows global digital advertising revenue by major platform from 2021 to 2025, illustrating both the dominance of the top three and the rapid growth of TikTok. The visual makes clear how concentrated the ad-funded internet has become: roughly two-thirds of all digital ad spending now flows through three companies.
Source: Company filings (Meta, Alphabet, Amazon 10-K and earnings releases), Bloomberg ByteDance estimates, eMarketer 2025 forecast. Figures in USD billions, worldwide ad revenue.
What the Numbers Mean
Three economic patterns stand out from the data above. First, the ad-funded internet has consolidated, not fragmented. The combined ad revenue of Google, Meta, and Amazon grew from roughly $355 billion in 2021 to $555 billion in 2025, a 56% increase, while their combined share of global digital ad spending stayed above 60% throughout. Network effects continue to compound.
Second, the boundaries between social media and other digital advertising are blurring. Amazon’s $69 billion in ad revenue makes it a top-three ad platform without being a social network in the traditional sense. YouTube is officially a video platform, but functions as social media for billions of users. Retail media, connected TV, and creator-driven commerce blend categories that were once distinct. The economics, however, remain the same: scarce attention, two-sided markets, network-effect protection.
Third, regulation and privacy changes are real costs but not existential threats. Apple’s ATT cost Meta over $10 billion, yet Meta’s revenue has grown by more than $80 billion since the policy was introduced. The DSA imposes compliance costs but does not break the business model. Antitrust cases threaten specific structures but proceed slowly. So far, regulation has shaped platform behaviour without dismantling platform power.
MASEconomics Explains
Four economic concepts behind social media markets
Conclusion
The economics of social media rests on four pillars: two-sided markets that price users at zero and advertisers at auction, network effects that produce winner-take-all dynamics, an attention economy in which time is the scarce input, and externalities that fall outside the price system. Together, they explain why three companies earn over $500 billion a year by giving their core product away.
The data from 2025 is unambiguous. Meta crossed $196 billion in ad revenue. Alphabet topped $400 billion in total revenue, with YouTube alone past $60 billion. ByteDance’s profits approached $50 billion. Concentration is increasing, not falling. Regulation in the EU has begun to bite at the margins; US enforcement is slower. Privacy changes from Apple have cost the sector tens of billions but have not broken the model. Decentralised alternatives remain small.
The market structure is stable, the externalities are real, and the policy debate is open. What economists know with confidence is that “free” social media has a price, that the price is paid in attention and data and social cost, and that the firms collecting the price are among the most valuable in the world.
Did you find this article helpful? Share it with someone who loves economics. And remember, at MASEconomics, we make complex ideas simple.