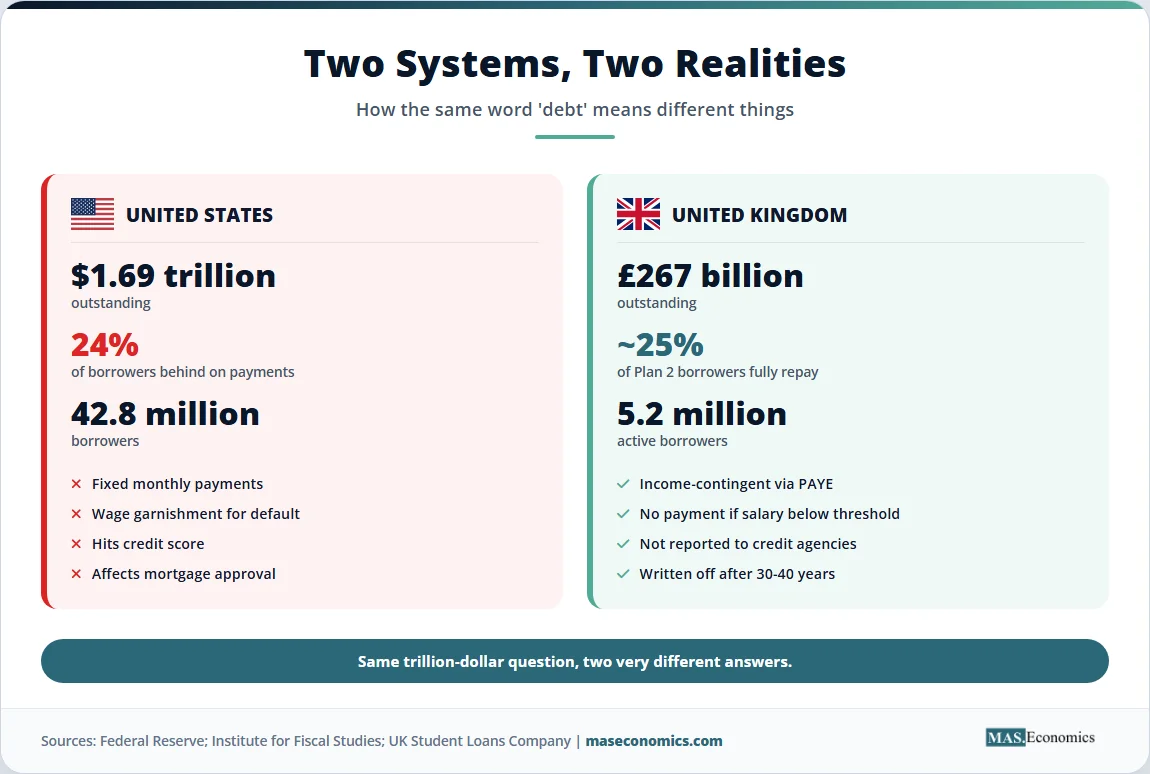
Student loans economics sits at the centre of the largest non-mortgage consumer debt category in the United States and the largest government-backed lending programme in the United Kingdom. Americans owed roughly $1.8 trillion in federal and private student loans at the end of 2025, spread across 42.8 million federal borrowers. The UK student loan book reached £267 billion at the end of March 2025, with the government forecasting it could approach £500 billion in 2023-24 prices by the late 2040s.
The two systems took different paths to similar problems. The US relies on a fixed-payment, debt-collection model with discrete repayment plans. The UK runs an income-contingent system collected through PAYE that functions, for most graduates, more like a graduate tax than a conventional loan. Both are now in the middle of major reforms. The Trump administration’s One Big Beautiful Bill Act (OBBBA) overhauls federal student aid from July 2026 onwards. The UK has just activated its Plan 5 repayment regime in April 2026, with thresholds frozen for years to come.
The economics behind these reforms reaches back to Gary Becker, Theodore Shultz, and Jacob Mincer. The policy decisions affect tens of millions of people, household balance sheets, and labour markets. The article that follows explains both.
Student Loan Debt by the Numbers
The scale of education debt has changed what student loans mean for an economy. In the US, federal student loan debt sat at roughly $516 billion in 2007. By December 2025, the federal portfolio alone reached $1.693 trillion across 42.8 million borrowers, with private loans adding around $145 billion on top. The average federal balance per borrower is $39,633, a record high.
The UK trajectory is sharper in percentage terms. In 2010, total outstanding student loan debt was below £40 billion. By March 2025, it had reached £267 billion across more than 5 million active borrowers, with around £21 billion in new lending issued each year to roughly 1.5 million students. The average debt for the 2024 cohort entering repayment was £53,000, the highest in OECD analysis of comparable countries.
What sets the two systems apart is not size but structure. US borrowers have fixed monthly obligations, default risk, and credit score consequences. UK borrowers have income-contingent repayments collected automatically through payroll, no credit reporting, and statutory write-off after 30 to 40 years. The economics of these designs explains why the same word “debt” describes very different financial instruments.
US and UK Student Loan Origins
The US federal student loan programme grew out of the 1965 Higher Education Act. Direct lending expanded sharply through the 1990s and 2000s, and in 2010, the federal government replaced bank-issued guaranteed loans with the Direct Loan programme. Tuition continued to rise faster than wages and faster than general inflation, with public university list prices roughly tripling in real terms between 1980 and 2020. The 2007-08 financial crisis added pressure as state appropriations to public universities fell sharply, shifting more of the cost onto students.
The UK system underwent three major redesigns. Tuition fees were introduced in 1998 at £1,000 per year, rose to £3,000 in 2006, and jumped to £9,000 in 2012 under the Cameron coalition. Each reform was paired with an income-contingent loan facility administered by the Student Loans Company, with repayments collected through HMRC. Reforms following the 2019 Augar Review produced Plan 5, which applies to students starting English universities from September 2023.
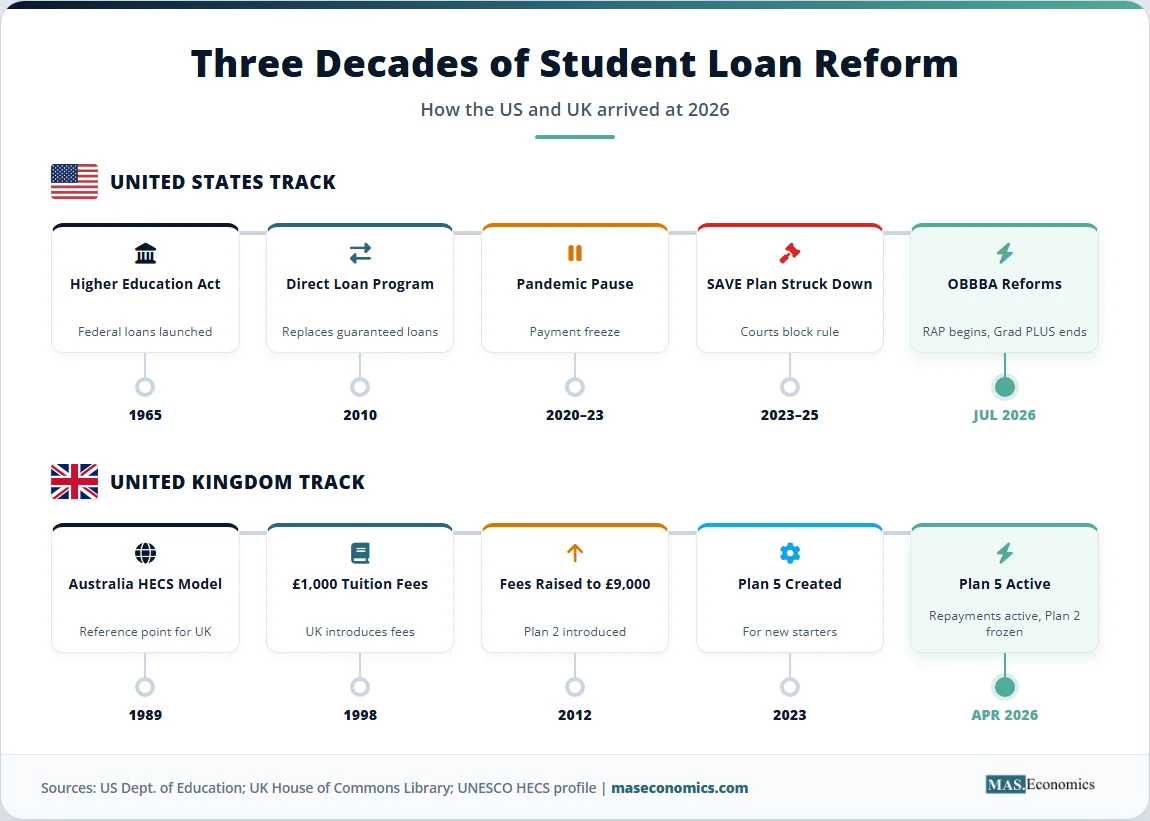
Australia’s HECS programme, introduced in 1989 under economist Bruce Chapman’s design, sits in the background of both systems. It became the model for income-contingent lending, later adopted in the UK, New Zealand, and parts of the US. Australia’s HELP debt now exceeds A$80 billion, with most graduates repaying at rates between 1% and 10% of total income above the threshold.
| System | Outstanding Debt | Borrowers | Repayment Mechanism | Write-off Period |
|---|---|---|---|---|
| United States (federal) | $1.69 trillion (Dec 2025) | 42.8 million | Fixed payments or income-driven plans | 20-30 years (IDR plans) |
| United Kingdom | £267 billion (Mar 2025) | ~5.2 million active | Income-contingent via PAYE | 25-40 years (plan dependent) |
| Australia (HELP) | ~A$80 billion | ~3 million | Income-contingent via tax system | No write-off (indexed only) |
| Canada | ~C$23 billion (federal) | ~1.7 million | Fixed payments with assistance plans | None (forgiveness for select fields) |

|
||||
Sources: US Department of Education Federal Student Aid (December 2025); UK House of Commons Library (March 2025); Australian Taxation Office; Statistics Canada.
Human Capital Theory of Student Loans
The intellectual foundation for student lending comes from Gary Becker’s 1964 work, Human Capital, which formalised the idea that schooling is an investment with both costs and returns. Theodore Shultz had argued in 1960 that much of what looks like consumption is in fact investment in human capital. Jacob Mincer turned the idea into an empirical equation that linked years of schooling to lifetime earnings.
The Mincer earnings function is the workhorse of the field:
Here \( w \) is wages, \( s \) is years of schooling, and \( x \) is labour market experience. The coefficient \( \beta \) gives the percentage return to an additional year of schooling. World Bank meta-analyses estimate average returns of around 9% per year of schooling globally, with tertiary education yielding the highest returns in advanced economies.
If returns to education are positive and large, why does the market not finance them on its own? The answer is a textbook capital-market failure. A 19-year-old has no collateral. Future earnings cannot be pledged. Lenders cannot easily price the credit risk of an individual whose adult productivity has not yet been observed. Without government intervention, capable students from low-income households would be priced out of education even when their expected returns exceed the cost of capital. This is the rationale that put student lending into public policy in the first place. For more on the link between education and growth, the article on the Solow-Swan growth model explains how human capital fits into long-run output.
The classic theory has competition. Michael Spence’s signalling model argues that education partly works as a signal of pre-existing ability rather than a producer of skills. Joseph Stiglitz and Andrew Weiss showed that asymmetric information between borrowers and lenders generates credit rationing rather than market clearing. Both are explored in the article on Spence’s signalling model and the broader treatment of information asymmetry in the Akerlof model.
The US Reform: RAP and New Limits
The most consequential change in US student loan policy in two decades is now in motion. The One Big Beautiful Bill Act, signed into law in July 2025, replaces the patchwork of income-driven repayment plans with two options for new borrowers from 1 July 2026.
The first is a Standard Repayment Plan with a window of 10 to 25 years depending on loan size. The second is the Repayment Assistance Plan (RAP), an income-contingent plan setting payments at 1% to 10% of adjusted gross income, with a $10 monthly minimum and forgiveness of any remaining balance after 30 years of payments.
Three legacy plans are being closed for new borrowers. Pay As You Earn (PAYE) and Income-Contingent Repayment (ICR) sunset by 1 July 2028. The Saving on a Valuable Education (SAVE) plan, the Biden-era affordable repayment programme, was struck down in court and is being officially wound up in 2026, with the Department of Education issuing 90-day notices to borrowers to switch plans. Income-Based Repayment (IBR) survives but only for loans disbursed before July 2026.
Borrowing limits also change. Graduate PLUS loans are eliminated for new borrowers from July 2026, with three-year transition rules for current students. Parent PLUS loans are capped at $20,000 per year and $65,000 lifetime per student. Annual aggregate caps for graduate students are restructured around programme type, with separate limits for medicine, law, and other professional degrees.
The economic logic of the reform draws on a long-running concern: that uncapped graduate borrowing combined with generous income-driven plans created a fiscal liability. Preston Cooper of the American Enterprise Institute notes that most borrowers with typical debt-to-income ratios will pay off well before any 30-year forgiveness applies, meaning the headline 30-year horizon is mostly relevant for high-debt graduate borrowers. The political economy is also clear: tuition pricing power is partly a function of how generous federal lending is, an idea associated with the Bennett hypothesis since the 1980s.
The UK Reform: Plan 5 and Frozen Thresholds
The UK system reached a turning point in April 2026 when Plan 5 repayments became active for the first time. Plan 5 applies to students who started higher education courses in England from August 2023 onwards. Its repayment threshold is fixed at £25,000 per year, frozen until April 2027, and then indexed to RPI. Repayments are 9% of income above the threshold. The interest rate is RPI only, with no margin above inflation. The write-off period extends to 40 years from the first repayment.
The threshold matters more than the headline numbers suggest. Plan 2 borrowers see their threshold rise from £28,470 to £29,385 in April 2026, with the government having announced a freeze at that level until April 2030. Inflation will gradually erode the real value of the threshold over those years, pulling more graduates into repayment and increasing what each repaying graduate hands over.
The Institute for Fiscal Studies estimates that only around 25% of Plan 2 borrowers will repay their loans in full before the 30-year write-off. The figure was even lower for cohorts entering during the threshold freeze. Government modelling suggests roughly 56% of full-time undergraduates starting in 2024-25 will repay in full, more than double the 32% forecast for the 2022-23 cohort, because of the design changes that come with Plan 5.
The change is not borrower-friendly in aggregate. Lower interest is offset by lower thresholds and longer write-offs. Independent IFS analysis suggests most Plan 5 borrowers will repay significantly more across their careers than Plan 2 borrowers would have. The reform shifts more of the long-run cost from the Treasury to graduates, particularly mid-career professionals on stable salaries who would otherwise have hit write-off.
The Data Behind the Debate
One way to see the divergence between the US and UK is to plot total outstanding student loan debt against time. The same upward slope masks very different mechanisms: in the US, balance growth comes from new lending plus interest accrual on existing balances; in the UK, balance growth is dominated by interest, since most cohorts accrue more in interest each year than they repay.
Source: US Department of Education Federal Student Aid Data Center; UK House of Commons Library “Student loan statistics” briefing (December 2025); figures in nominal currency.
The chart shows two systems whose nominal debt stocks have grown by roughly the same multiple since 2010. The US figure passed $1.69 trillion in late 2025; the UK figure crossed £267 billion. In both cases, the rate of new lending exceeds the rate of repayment plus principal write-down, which is the arithmetic that drives the upward slope.
One distinction is more important than the headline level. In the US, total balances translate into actual cash flows that borrowers must produce monthly. In the UK, more than half of the headline £267 billion will never be collected, because most balances will hit write-off before being paid in full. UK accounting recognises this through the RAB (Resource Accounting and Budgeting) charge, which estimates the share of new lending that the Treasury expects not to recover. The methodology shift in 2018 that moved most of these losses on-budget made the fiscal cost of the system newly visible.
Default and Macroeconomic Effects
The collection mechanism shapes what student debt does to the macroeconomy. The Federal Reserve found that roughly 24% of US borrowers with payments due were behind on those payments after the pandemic-era pause ended in 2023. Delinquency rates climbed sharply in 2025 once collections on defaulted loans resumed, including wage garnishment. Defaulted loans carry credit-score consequences and can affect mortgage approval, vehicle loans, and even housing rentals.
The UK system has no equivalent default category. Repayments are collected automatically through PAYE when income exceeds the threshold. There is no missed payment to report and no impact on credit scores. Borrowers below the threshold simply pay nothing. This insulates household balance sheets during recessions and protects the wider credit system, but it also means the cost of the loan is invisible to most borrowers until salary deductions begin.
The macroeconomic footprint is large in both directions. Federal Reserve research has linked US student debt to delayed home purchases, lower marriage rates, and reduced small-business formation among younger cohorts. The Office for Budget Responsibility in the UK treats the loan book as a contingent fiscal liability. Both effects feed into the broader literature on debt sustainability and on how student lending interacts with fiscal policy.
Policy Implications for Borrowers and Treasuries
The US reform tightens borrowing limits, narrows repayment options, and pushes more graduate students towards private credit. The expected effect on tuition is debated. Bennett hypothesis advocates argue that institutions raise list prices to absorb available federal aid, so caps could moderate price growth. Critics counter that the income-elastic nature of higher education demand means graduate programmes will simply shift to private lending without much price discipline. Whichever view holds, the reform shifts risk towards individual borrowers and away from the federal balance sheet.
The UK reform locks in a longer-run revenue stream from graduates by extending write-off horizons and freezing thresholds. The Treasury captures more of the lifetime value of each graduate’s earnings through what is effectively a graduate income surtax. Because PAYE collection is automatic, compliance costs are low and political visibility is muted. The trade-off is that real graduate take-home income at mid-career levels falls, with possible second-order effects on housing, savings, and demand for postgraduate study.
Both reforms point to a broader tension. Higher education delivers measurable private returns of 5-15% per year of schooling and substantial public spillovers in productivity, tax revenue, and civic participation. The instrument used to finance access affects who pays, when, and under what circumstances. Income-contingent designs spread risk between borrower and government. Fixed-payment designs sharpen accountability but create default tail risk. Neither design escapes the underlying market failure that justified public lending in the first place.
MASEconomics Explains
Four economic concepts behind student loans
Conclusion
Student loans economics shows how a single policy instrument can generate trillion-dollar balance sheets, decade-long political battles, and real changes in household behaviour. The US carries $1.8 trillion in education debt across 42.8 million borrowers, with the One Big Beautiful Bill Act reshaping repayment options and borrowing limits from July 2026. The UK carries £267 billion across 5.2 million borrowers, with Plan 5 now active and Plan 2 thresholds frozen for the rest of the decade. Both systems rest on the human capital framework developed by Becker, Schultz, and Mincer, and both respond to the same capital market failure that made public lending necessary in the first place. The design choices differ in collection mechanism, default risk, and write-off horizon, and those differences produce very different outcomes for borrowers and treasuries even when the underlying economics are the same.
Did you find this article helpful? Share it with someone who loves economics. And remember, at MASEconomics, we make complex ideas simple.