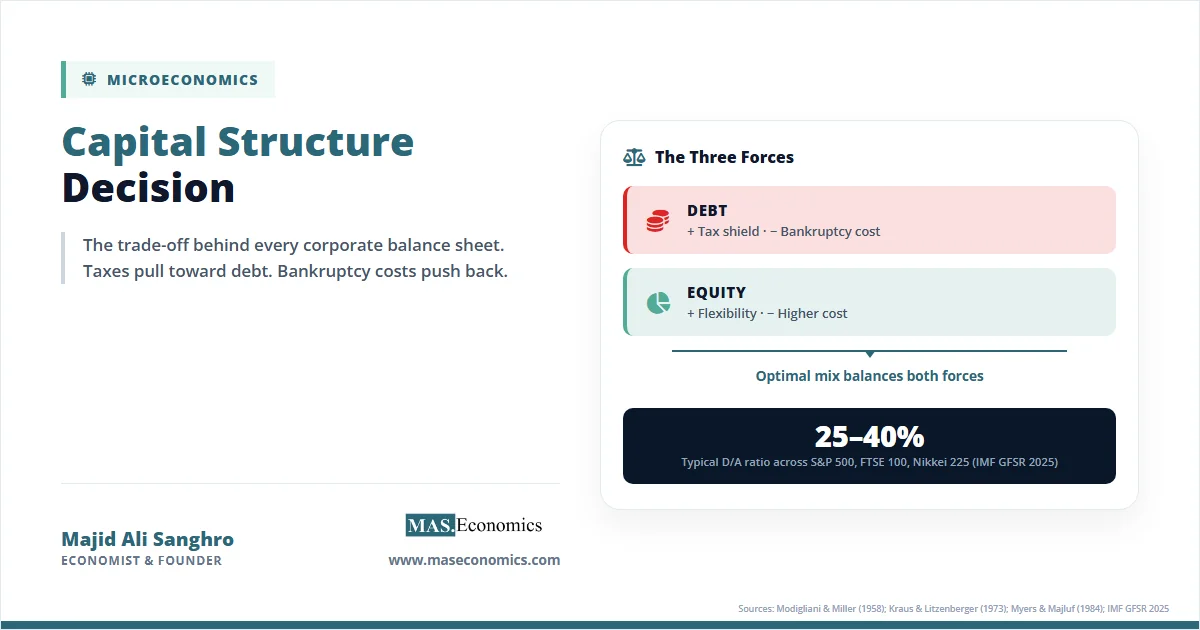
The Capital Structure Decision is the choice every firm must make about how to finance its assets through some combination of debt and equity. Despite a vast theoretical literature, real-world behaviour follows a striking pattern. According to the IMF Global Financial Stability Report 2025, large non-financial corporations across the FTSE 100, S&P 500, and Nikkei 225 cluster within a remarkably narrow band of debt-to-asset ratios, typically between 25 and 40 percent. Pure theory might predict either zero leverage or full leverage depending on which frictions dominate. The data say neither extreme prevails.
The central trade-off is simple to state. Debt is cheap because interest payments are tax-deductible, but debt is risky because it creates fixed obligations that can trigger default and distress costs. Equity is expensive because shareholders demand higher returns to bear residual risk, but equity is flexible because dividends can be suspended without legal consequence. The capital structure decision is the search for the mix that maximises firm value given these competing forces.
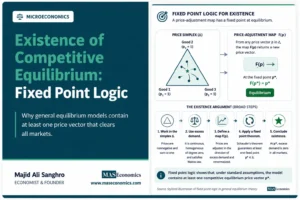
The starting benchmark is the work of Franco Modigliani and Merton Miller. Their 1958 paper showed that in a frictionless world, the mix of debt and equity does not affect firm value. The result is striking precisely because it is counterintuitive, and the rest of corporate finance has been an exercise in working out what happens when its assumptions are dropped. Readers who want the full theoretical treatment can consult the existing analysis of the Modigliani-Miller Theorem. This article focuses on the practical decision: what firms actually do when taxes, bankruptcy costs, and information asymmetries enter the picture.
How the Decision Works
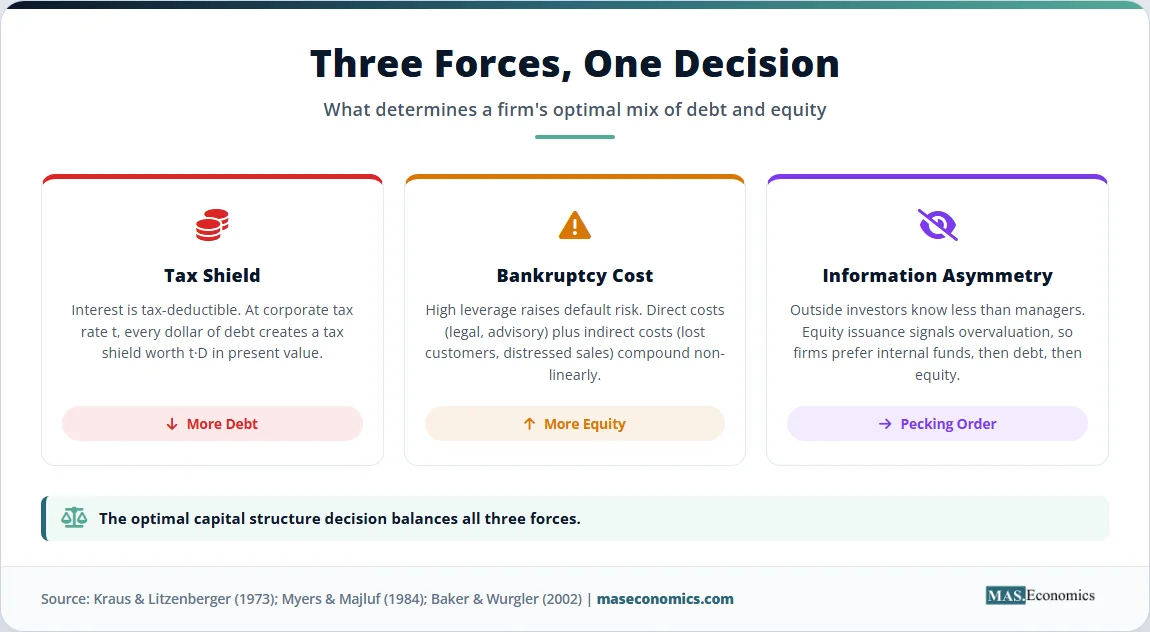
Three theories dominate modern corporate finance. Each takes a different friction as primary and produces a different prediction about leverage behaviour. Together, they provide a working framework for understanding the capital structure decision in practice.
Static Trade-off Theory
Kraus and Litzenberger (1973) formalised the idea that firms balance the tax shield from debt against the expected costs of bankruptcy. The tax shield arises because interest payments reduce taxable corporate income, so each dollar of debt creates a stream of tax savings. Bankruptcy costs include direct legal and advisory fees, as well as indirect costs such as lost customers, distressed asset sales, and management distraction during financial stress. The optimal capital structure is the leverage point where the marginal tax benefit of an additional dollar of debt equals the marginal expected bankruptcy cost.
The firm-value equation under the trade-off theory is:
where \( V_{\text{levered}} \) is the value of the firm with debt, \( V_{\text{unlevered}} \) is the value without debt, \( t \) is the corporate tax rate, and \( D \) is the level of debt. The trade-off theory predicts a target leverage ratio for each firm and mean-reversion toward that target after deviations.
Pecking Order Theory
Myers and Majluf (1984) approached the problem from a different angle. They observed that managers know more about a firm’s prospects than outside investors do. This asymmetric information means that issuing equity sends a negative signal because rational investors infer that managers issue stock when they believe the firm is overvalued. To avoid this signalling cost, managers prefer financing in a strict order: internal funds first, then debt, then external equity as a last resort. Their analysis, set out fully in Myers (1984), predicts no target leverage ratio at all. Capital structure is whatever emerges from following the hierarchy through a sequence of investment decisions.
Market Timing Theory
Baker and Wurgler (2002) proposed a third explanation. Firms issue equity when their share price is high relative to fundamentals and repurchase shares or issue debt when the price is low. Their empirical work showed that capital structure is largely the cumulative outcome of past timing decisions rather than a deliberate target. A firm that issued equity during a market peak a decade ago carries the imprint of that decision for years afterward. The persistence is the key empirical finding.
The WACC Formula
The weighted average cost of capital ties the three theories together by providing a single measure of how leverage affects the firm’s overall financing cost:
where \( E \) is equity value, \( D \) is debt value, \( V = E + D \), \( r_e \) is the cost of equity, \( r_d \) is the cost of debt, and \( t \) is the corporate tax rate. The factor \( (1 – t) \) captures the tax deductibility of interest payments.
As leverage rises from zero, WACC initially falls. The reason is twofold: debt itself is cheaper than equity in pre-tax terms, and the tax shield reduces the after-tax cost of debt further. Beyond a certain point, however, WACC turns upward. Higher leverage raises the probability of distress, which raises \( r_d \) directly through credit spreads and raises \( r_e \) indirectly because equity holders bear more residual risk. The minimum point of the WACC curve corresponds to the optimal capital structure under the trade-off theory.
| Theory | Lead Authors (Year) | Key Insight | What Determines Leverage | Predicted Behaviour |
|---|---|---|---|---|
| Static Trade-off | Kraus & Litzenberger (1973) | Tax shield versus bankruptcy costs | Tax rate, asset volatility, distress costs | Target leverage ratio; mean-reversion toward target |
| Pecking Order | Myers & Majluf (1984) | Asymmetric information between managers and investors | Availability of internal funds | Internal funds, then debt, then equity; no target ratio |
| Market Timing | Baker & Wurgler (2002) | Time-varying mispricing of equity | Past valuation peaks and troughs | Cumulative result of timing decisions; persistent |

|
||||
Capital Structure in Practice
Three real cases show how the theories play out in firm behaviour. Each illustrates a different combination of forces at work in the capital structure decision.
Apple
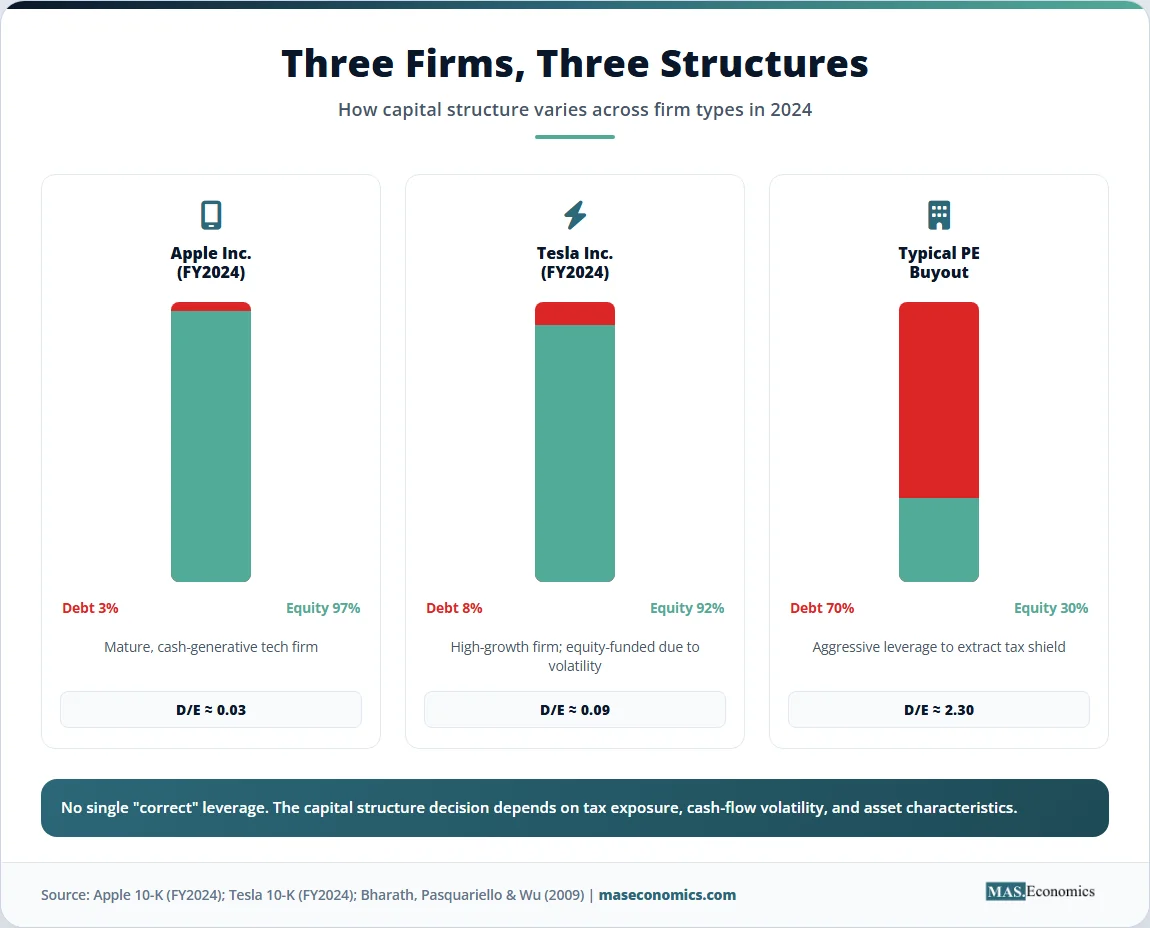
Apple operated with a cash-only balance sheet through 2012. The shift began in 2013 when the company started issuing investment-grade debt to fund share buybacks and dividends. Two factors drove the change. First, much of Apple’s cash was held offshore and would have triggered a substantial repatriation tax bill if brought back to the United States, a constraint that loosened only with the 2017 Tax Cuts and Jobs Act. Second, long-term interest rates were near historical lows, so locking in cheap debt was attractive even for a firm that did not strictly need external financing. By fiscal year 2024, according to Apple’s 10-K filings, total debt stood at roughly 100 billion dollars against a market capitalisation of approximately 3 trillion dollars, giving a leverage ratio of about three percent. Apple’s structure reflects a firm where the tax-arbitrage motive dominates, and bankruptcy costs are negligible.
Tesla
Tesla presents the opposite case. As a high-growth firm with volatile cash flows and large capital requirements, Tesla used minimal debt through its early years. The pecking order ran in reverse here because debt markets demanded too high a premium on a high-volatility, negative-cash-flow firm. Equity issuance, including convertible bonds that combine debt and equity features, was actually the cheaper option. According to Tesla’s 10-K filings, the firm’s debt-to-equity ratio in fiscal year 2024 stood below 0.1, far below the auto-industry average of roughly 0.6. Tesla’s structure reflects the constraint that cash-flow volatility and intangible-asset collateral make debt expensive even when tax shields are theoretically available.
Private Equity
The classic leverage-up case is the private equity buyout. KKR’s 1989 acquisition of RJR Nabisco took the target from low leverage to roughly 90 percent debt financing, a textbook test of trade-off theory at the limits. Modern private equity follows the same template, though typically with debt financing in the 60 to 70 percent range. The mechanism is straightforward: by loading the target with debt, the acquirer captures a large tax shield, disciplines management with high fixed obligations, and amplifies returns to the equity sliver. The empirical study by Bharath, Pasquariello, and Wu (2009) documented systematic increases in target firm leverage after buyout. Aggregate trends in corporate leverage, including the rise of private credit financing, are tracked in the IMF’s Global Financial Stability Report.
The three cases together show that no single optimal leverage exists. Apple chooses low debt because its cash flows are stable, but its tax position favours minimal external financing. Tesla chooses low debt because its cash flows are volatile and debt markets price that volatility. Private equity chooses high debt because the tax shield is large and the discipline of fixed obligations is the point of the strategy.
The Data Behind the Trade-Off
The chart below shows how firm value behaves as leverage rises under three different assumptions: the original Modigliani-Miller world without taxes or frictions, the world with corporate taxes only, and the trade-off world with both taxes and bankruptcy costs.
Source: Kraus & Litzenberger (1973); MASEconomics illustration. The trade-off curve peaks where the marginal tax benefit of debt equals the marginal expected bankruptcy cost.
The flat grey line captures the original Modigliani-Miller result: in a frictionless world, leverage does not affect firm value at all. The teal line adds corporate taxes and shows that firm value rises linearly with debt because of the tax shield, predicting that optimal leverage approaches 100 percent. The mint line adds bankruptcy costs and produces an inverted U-shape with an interior optimum near a debt-to-value ratio of 0.4. The red marker identifies the optimum, where the marginal tax benefit of additional debt just balances the marginal expected bankruptcy cost. Real firms cluster around this region, though substantial variation exists by industry and firm characteristics.
Where the Theory Breaks Down
The trade-off, pecking order, and market timing theories provide a workable framework, but each has known limits. Four points stand out.
First, capital structure decisions are jointly determined with investment, payout, and risk-management policies. A firm that issues debt to fund a new factory is making three decisions at once: how to finance, what to build, and how much risk to take. Treating capital structure as a partial-equilibrium problem is a simplification that may miss important interactions. Empirical tests that fail to account for joint determination produce biased estimates of leverage targets.
Second, optimal leverage varies enormously across industries, countries, and firm life-cycle stages. Utility companies in stable regulatory environments routinely carry debt above 60 percent of assets because their cash flows are predictable and their physical assets serve as good collateral. Technology firms carry debt below 10 percent because their assets are largely intangible, their cash flows are volatile, and their growth options are difficult to pledge. The same trade-off logic applies in both cases, but the parameters differ enough to produce dramatically different optimal structures.
Third, behavioural anchoring complicates the picture. The CFO survey by Graham and Harvey (2001) showed that managers anchor on industry medians more than on firm-specific factors. Rather than independently optimising, many CFOs benchmark against peers, which produces clustering around industry norms even when those norms are not individually optimal. This deviation from frictionless optimisation is a behavioural reality that pure trade-off models miss.
Fourth, tax regimes and country-level institutional variation shape outcomes. Germany and Japan, with universal banking systems and concentrated ownership structures, generate different leverage patterns than the United States and the United Kingdom, where dispersed ownership and active equity markets dominate. The trade-off theory’s tax-shield benefit varies with each jurisdiction’s corporate tax code, deductibility rules, and personal-level taxation of interest and dividends. Cross-country comparisons must adjust for these differences before drawing conclusions about firm behaviour.
MASEconomics Explains
4 economic concepts behind the capital structure decision
Conclusion
The Capital Structure Decision is not the irrelevance result that Modigliani and Miller proved in their original 1958 paper. It is the trade-off that emerges once their frictionless assumptions are dropped. Taxes pull firms toward debt because interest is deductible. Bankruptcy costs push back because high leverage raises the probability and severity of distress. Asymmetric information adds a third force, generating the pecking order that places internal funds ahead of debt and debt ahead of equity. Market timing adds a fourth, making capital structure partly the cumulative footprint of past valuation episodes.
The empirical record across major equity indices shows leverage ratios clustered between 25 and 40 percent of assets, neither the zero nor the one hundred percent that pure theories at extremes might suggest. Apple’s three percent leverage, Tesla’s eight percent, and a leveraged buyout’s seventy percent reflect the same underlying logic applied to firms with different tax positions, cash-flow volatilities, and asset characteristics. Frictions, not their absence, shape the capital structure decision in practice.
Did you find this article helpful? Share it with someone who loves economics. And remember, at MASEconomics, we make complex ideas simple.