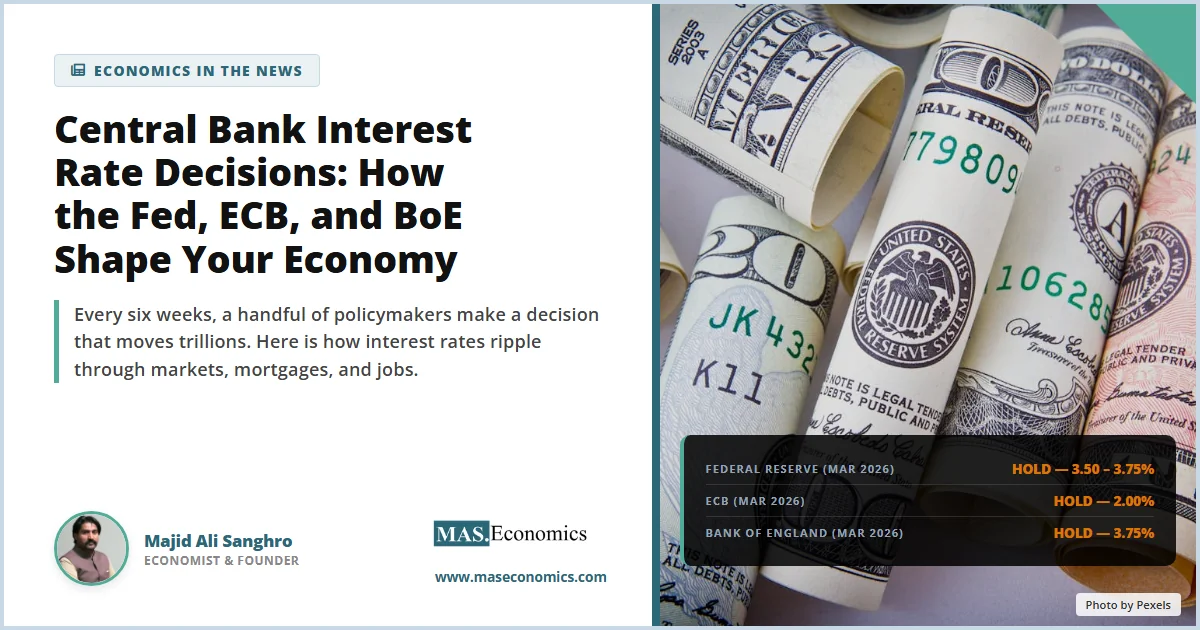
On March 18, 2026, three of the world’s most powerful institutions, the Federal Reserve, the European Central Bank (ECB), and the Bank of England (BoE), all held their benchmark interest rates steady within 24 hours of each other. The Fed kept its rate at 3.50-3.75%. The ECB held at 2.00%. The Bank of England held at 3.75%. All three cited the same reason: the war in Iran had made the economic outlook “significantly more uncertain.”
These decisions, made by unelected committees of economists meeting behind closed doors, directly affect the mortgage payments of hundreds of millions of households, the borrowing costs of every business, the value of every pension fund, and the trajectory of inflation that determines how far your salary stretches at the supermarket.
This article explains how central bank interest rate decisions work, their importance, and how to read the signals that move markets, drawing on our detailed explainers of central banking and monetary policy, monetary policy tools, and the Taylor Rule.
Where Rates Stand Right Now
The global interest rate landscape in early 2026 is shaped by two colliding forces: a rate-cutting cycle that began in 2024 and an oil shock that threatens to reignite inflation. The result is paralysis; central banks that want to cut cannot, and central banks that might need to hike are not yet ready.
Table 1: Major Central Bank Policy Rates, March 2026
| Central Bank | Current Rate | Last Change | 2026 Outlook |
|---|---|---|---|
| US Federal Reserve | 3.50-3.75% | Dec 2025 (cut 25 bps) | Median dot plot: 1 cut in 2026; markets price at most 2 |
| European Central Bank | 2.00% (deposit rate) | Jun 2025 (cut 25 bps; 8th cut since Jun 2024) | On hold; traders now betting on 2 hikes in 2026 |
| Bank of England | 3.75% | Dec 2025 (cut 25 bps; 4th cut of 2025) | Unanimous hold in March; markets price ~40 bps of tightening by year-end |
| Bank of Japan | 0.50% | Jan 2025 (hike 25 bps) | Further normalisation expected; energy costs complicate timing |
| Bank of Canada | 2.75% | Mar 2026 (cut 25 bps) | Further easing expected as economy weakens |
 | |||
Sources: Federal Reserve, ECB, Bank of England, Trading Economics, March 2026.
The most striking development is the divergence between expectations before and after the Iran conflict. Before the war began in late February, the ECB was expected to hold or cut further, and the BoE was widely expected to cut in March. Instead, both held, and traders are now pricing in the possibility of rate increases, a dramatic reversal driven entirely by the energy shock.
How Interest Rate Decisions Actually Work
Central banks control the economy primarily through one lever: the short-term interest rate at which commercial banks borrow from each other overnight. In the US, this is the federal funds rate. In the UK, it is the Bank Rate. In the eurozone, it is the deposit facility rate.
When the central bank raises this rate, it becomes more expensive for banks to borrow money. Banks pass this cost to consumers and businesses through higher mortgage rates, loan rates, and credit card rates. Spending slows, demand falls, and eventually, inflation comes down. When the central bank cuts, the reverse happens: borrowing becomes cheaper, spending increases, and the economy is stimulated.
This is the monetary transmission mechanism, and it operates through several channels simultaneously:
The interest rate channel: The most direct route. Higher rates increase the cost of borrowing for mortgages, car loans, and business investments. Lower rates reduce it.
The exchange rate channel: Higher interest rates attract foreign capital, strengthening the domestic currency. A stronger currency makes imports cheaper (reducing inflation) but makes exports more expensive (hurting growth). We explore this dynamic in detail in our article on exchange rates in global trade.
The asset price channel: Interest rates affect the valuation of stocks, bonds, and property. Lower rates push investors into riskier assets, inflating prices. Higher rates bring valuations down. This is why stock markets react so intensely to central bank announcements.
The expectations channel: Perhaps the most powerful. If businesses and consumers believe the central bank will keep inflation at 2%, they set wages and prices accordingly. This is why central bank communication, press conferences, minutes, “dot plots”, matters as much as the rate decision itself.
The Federal Reserve
The Federal Reserve entered 2026 having cut rates three consecutive times in the final quarter of 2025, bringing the federal funds rate from 4.75-5.00% to 3.50-3.75%. The cuts were described as “maintenance” moves to support a weakening labour market.
Then the landscape shifted. The Iran war sent oil prices surging, threatening to push inflation back up. At the same time, job creation has slowed dramatically. Fed Chair Jerome Powell noted in March that “job creation in the US has slowed to essentially zero.” The unemployment rate stood at 4.4% in February, and the Fed projects it will remain there through year-end.
This is the classic central banking dilemma: an oil shock raises inflation (suggesting rates should stay high or rise) while simultaneously weakening economic activity (suggesting rates should fall). The chart below shows the Fed’s rate trajectory since 2020.
Source: Federal Reserve. Data through March 2026. The shaded region represents the current target range.
The Fed’s updated economic projections from March 2026 tell the story of this tension. Officials now expect GDP growth of 2.4% (revised up), inflation of 2.7% (revised up), and unemployment of 4.4% (unchanged). The median “dot plot” projection still points to one rate cut in 2026 and another in 2027, but the range is wide; at least one official sees four cuts, while others have discussed the possibility that hikes could become necessary.
Adding political uncertainty to the mix, Chair Powell’s term at the helm expires in early 2028, but the administration has repeatedly pressured him, and prediction markets point to BlackRock’s Rick Rieder as the likely successor. The question of central bank independence, which our blog explores in depth, has rarely been more salient.
The ECB
The European Central Bank delivered the most aggressive easing cycle in its history in 2024 and 2025, cutting rates eight times from June 2024 to bring the deposit rate down to 2.00%. By early 2026, ECB President Christine Lagarde was describing the eurozone economy as being “in a good place.”
The Iran war changed everything. Europe imports nearly all of its oil and a significant share of its natural gas. European gas futures surged 85% in a single month after the attacks on Qatar’s Ras Laffan complex. Lagarde quickly walked back her optimism, telling reporters in March: “I’m not saying we are in a good place; I’m saying we are well-positioned and well-equipped to deal with the development of a major shock.”
The ECB now faces what ING economists have called a “genuine dilemma.” Higher energy prices push inflation up (the ECB’s March projection already raised 2026 headline and core inflation expectations). But the eurozone’s growth was already sluggish before the war; Germany’s economy has been stagnating, and the continent’s structural challenges (high energy costs, regulatory burden, demographic headwinds) have not disappeared.
Traders have responded by pricing in more than two quarter-point hikes from the ECB in 2026, according to Bloomberg. This represents a dramatic shift from the rate-cutting trajectory that was expected just weeks earlier.
The Bank of England
The Bank of England’s March 2026 decision was perhaps the most telling of the three. Before the Iran war, the BoE was widely expected to cut rates at its March meeting. The UK economy had been weak; monthly GDP was flat in January, unemployment stood at a five-year high of 5.2%, and there had been “continued disinflation in domestic prices and wages.”
Instead, the Monetary Policy Committee voted unanimously to hold. The statement made clear why: “Conflict in the Middle East has caused a significant increase in global energy and other commodity prices.” The BoE warned that CPI inflation, which had been 3.0% in January, could rise to 3.5% by the third quarter as energy costs feed through.
One MPC member went further in their individual statement, noting that “the balance between inflation and activity has shifted away from considering a cut towards considering a longer hold, or even a hike at some point.” Markets are now pricing in approximately 40 basis points of monetary tightening from the BoE by year-end, a complete reversal from the easing expectations that prevailed in February.
The UK illustrates a pattern that has played out in every major oil shock since the 1970s: energy crises force central banks to choose between fighting inflation and supporting growth. The Bank of England’s response in 2026 echoes the dilemma it faced in 2022, which we analyse in our article on energy price shocks and inflation.
How to Read a Central Bank Decision
Understanding central bank communication is a practical skill. Here is what to watch.
Table 2: A Guide to Central Bank Signals
| Signal | What It Means | Market Reaction |
|---|---|---|
| “Inflation remains somewhat elevated” | The central bank is not ready to cut rates; may even be considering hikes | Bond yields rise; stocks fall; currency strengthens |
| “Uncertainty about the economic outlook remains elevated” | The central bank is hesitant to commit in either direction; data-dependent | Moderate volatility; markets watch data releases closely |
| “Job gains have remained low” | The labour market is weakening; this tilts toward rate cuts | Bond yields fall; rate-sensitive stocks (real estate, utilities) rise |
| Dot plot shows wide dispersion | Committee members disagree sharply; policy path is genuinely uncertain | Volatility increases; short-term traders cautious |
| Dissenting votes (for a cut vs. hold) | Pressure is building within the committee to change course | Markets adjust rate expectations in the direction of the dissent |
| ||
At the March 2026 Fed meeting, two of these signals appeared simultaneously: the statement said “inflation remains somewhat elevated” and “job gains have remained low.” This combination, high inflation plus a weak labour market, is what makes the current moment so difficult for policymakers. It is the same tension that defines stagflation, a scenario explored in our article on the Strait of Hormuz crisis.
Macroeconomic Outlook
The path of interest rates for the remainder of 2026 depends on the interplay of three forces: the oil shock, the labour market, and inflation data.
Table 3: Interest Rate Scenarios for the Remainder of 2026
| Scenario | Fed Funds Rate (Year-End) | ECB Deposit Rate | BoE Bank Rate |
|---|---|---|---|
| Oil shock fades; disinflation resumes (Base) | 3.25-3.50% (1-2 cuts) | 1.75-2.00% (0-1 cuts) | 3.50% (1 cut) |
| Prolonged oil shock; inflation re-accelerates (Moderate) | 3.50-3.75% (no change) | 2.25-2.50% (1-2 hikes) | 4.00% (1 hike) |
| Stagflation: high inflation + recession (Severe) | 3.00-3.25% (emergency cuts despite inflation) | 2.00% (hold; fiscal policy takes the lead) | 3.75% (hold; deep dilemma) |
| Labour market collapses; oil normalises (Tail risk) | 2.75-3.00% (aggressive cuts) | 1.50% (resume cutting) | 3.00-3.25% (multiple cuts) |
| |||
Source: MASEconomics scenario analysis based on projections from the Federal Reserve, ECB, Goldman Sachs, and market pricing as of March 2026.
Long-Term Implications
The era of ultra-low rates is over. For most of the 2010s, interest rates across the developed world hovered near zero (or even below, in the case of the ECB and Bank of Japan). That era ended definitively with the post-COVID inflation surge. Even in the current easing cycle, rates are settling at levels far above the zero-bound; the “neutral rate” that neither stimulates nor restrains the economy is now estimated at 3.0-3.25% in the US, according to the Fed’s own projections.
Central bank independence is under pressure. The relationship between political leaders and central bankers has become increasingly fraught. In the US, the administration has moved to dismiss a Fed governor, subpoenaed the chair, and publicly pressured for lower rates. This tension is not new; it is a recurring theme in the history of central bank independence, but its intensity in 2026 is exceptional.
Divergence creates opportunity and risk. The fact that the Fed, ECB, and BoE are all holding at different rates (3.625%, 2.00%, and 3.75%) with different outlooks creates significant exchange rate movements. The BoE rate is the highest in the G7, which has supported the pound but hurt UK exporters. Rate divergence also affects capital flows, as investors move money toward higher-yielding currencies, a dynamic our article on the Mundell-Fleming model explains in detail.
MASEconomics Explains
Four economic concepts you need to understand interest rate decisions
The Taylor Rule
A formula proposed by economist John Taylor that prescribes how central banks should adjust interest rates in response to changes in inflation and economic output. When inflation rises above the target, the rule says rates should increase by more than the inflation rise. When output falls below potential, rates should decrease. The Taylor Rule is not followed mechanically, but it serves as a benchmark for evaluating central bank decisions.
The Neutral Interest Rate
The theoretical interest rate that neither stimulates nor restrains the economy. When the actual rate is below neutral, monetary policy is “accommodative” (encouraging borrowing and spending). When above, it is “restrictive” (cooling the economy). The Fed currently estimates the neutral rate at 3.0-3.25%, meaning the current rate of 3.50-3.75% is mildly restrictive.
Central Bank Independence
The principle that monetary policy decisions should be made by technocratic institutions free from political interference. Research consistently shows that independent central banks deliver lower and more stable inflation. When independence is compromised, inflation expectations can become “unanchored,” forcing even more painful policy adjustments later.
Forward Guidance
The practice of central banks signalling their future policy intentions to influence market expectations today. The Fed’s “dot plot,” the ECB’s “data-dependent, meeting-by-meeting” language, and the BoE’s minutes all serve as forward guidance tools. Effective guidance can do much of the work of a rate change without actually moving rates, by shaping how businesses and consumers plan.
Want to understand these concepts in more depth? Explore our full library of economic explainers, from the Taylor Rule to central bank independence.
Explore the MASEconomics Blog →The Next Decision Is Always Around the Corner
Central bank interest rate decisions are among the most consequential economic events in the world. They determine the cost of your mortgage, the return on your savings, the value of your pension, and the pace of economic growth. Yet they are made by small committees of unelected officials balancing imperfect data, competing risks, and immense political pressure.
The March 2026 triple hold, Fed, ECB, and BoE all standing pat in the face of an oil shock, captures the central dilemma of modern monetary policy. Inflation is too high to cut. Growth is too weak to hike. And uncertainty, driven by war in the Middle East and trade policy upheaval, is too great to commit to any path with confidence.
The next round of decisions comes in late April and early May. By then, we will know more about the duration of the Hormuz closure, the trajectory of oil prices, and the health of labour markets in the US, UK, and eurozone. Until then, markets, businesses, and households are all navigating by the same compass: the words, projections, and signals of central bankers who are themselves navigating in the fog.
Did you find this article helpful? Share it with someone who loves economics. And remember, at MASEconomics, we make complex ideas simple.