When Pepsi raised prices by 12 percent in 2022 to offset rising input costs, Coca-Cola gained nearly two percentage points of market share over the following six months without changing its own prices. The same year, a temporary shortage of game consoles cut sales of console video games by roughly a quarter, even though game prices remained unchanged. Two unrelated stories, both driven by the same underlying mechanism. The cross-price elasticity of demand measures how the quantity demanded of one good responds when the price of another good changes, and it is the parameter that determines whether two products compete with each other, complement each other, or operate in entirely separate worlds.
Among the four standard elasticities, cross-price elasticity is the one that maps most directly onto strategic business decisions. Price elasticity tells a firm how its own customers respond to its own price changes. Income elasticity tells it how demand will shift over the business cycle. Cross-price elasticity tells it which competitors matter, which products belong together in a bundle, and how vulnerable its pricing is to a rival’s discount. For policymakers, the same parameter governs how a tax on one good will spill into related markets, and whether two products should be treated as part of the same competitive market for antitrust purposes.
What Cross-Price Elasticity Measures
Cross-price elasticity of demand (XED) is the percentage change in the quantity demanded of one good divided by the percentage change in the price of another good:
CROSS-PRICE ELASTICITY OF DEMAND
The mechanics are similar to the price elasticity of demand and supply, but the price in the denominator belongs to a different good. The interpretation, however, runs along a different axis. Where price elasticity classifies demand as elastic or inelastic, cross-price elasticity classifies the relationship between two goods. Three categories cover the entire range of possibilities.
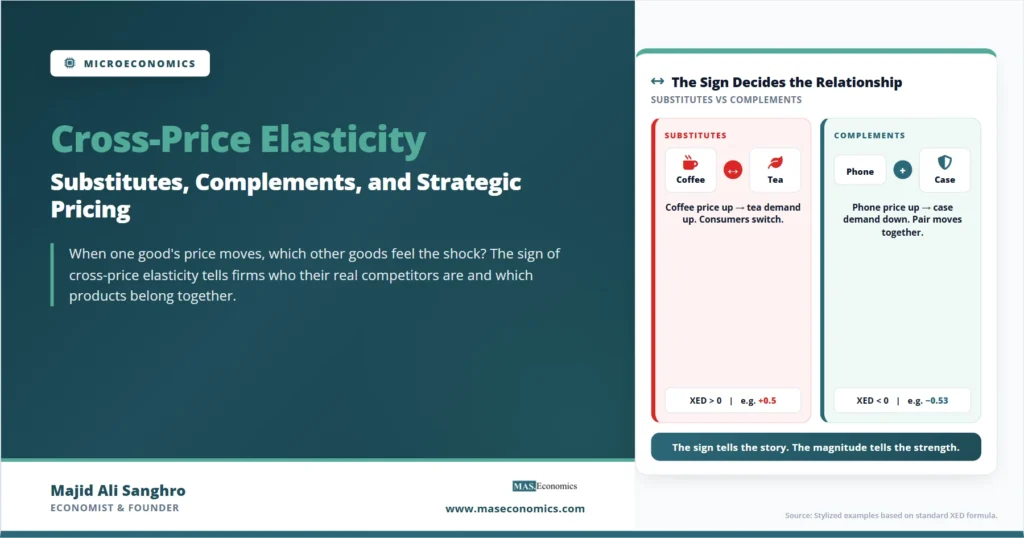
Positive XED: substitutes. When the price of one good rises and demand for the other rises in response, the two goods serve similar purposes, and consumers shift between them. Higher Pepsi prices push consumers toward Coca-Cola. Higher beef prices push consumers toward chicken. The larger the positive value, the closer the two goods are as substitutes in consumer preferences.
Negative XED: complements. When the price of one good rises and demand for the other falls in response, the two goods are consumed together. Higher game console prices reduce demand for video games. Higher car prices reduce demand for gasoline. The larger the negative value (in absolute terms), the more tightly the two goods are linked in actual consumption.
XED near zero: unrelated goods. When a price change in one good has no measurable effect on demand for another, the two products operate in separate markets. The price of dishwashers has essentially no effect on demand for mobile phone services. Most pairs of randomly chosen goods sit in this category.

Worked Examples on Both Sides
The cleanest way to see the formula in action is with two concrete cases, one for each sign.
Consider tea and coffee, which most consumers treat as substitutes for their morning caffeine. Suppose coffee prices rise by 10 percent following a poor harvest in Brazil. In response, tea sales rise by 5 percent. The XED for tea with respect to coffee is:
A positive XED of 0.5 confirms the substitute relationship. The moderate magnitude indicates that while some coffee drinkers do switch to tea, many do not, since the two beverages are not perfect substitutes. Coffee loyalists keep buying coffee even when it gets more expensive, which limits the cross-substitution.
Now consider phones and phone cases, which are consumed together. Suppose smartphone prices rise by 15 percent and quantity demanded for phone cases falls by 8 percent because fewer new phones are being bought. The XED for cases with respect to phones is:
A negative XED of approximately −0.53 confirms the complement relationship. The magnitude tells the case manufacturer that their sales are closely tied to phone sales, which has implications for their inventory planning and exposure to phone-market shocks. A company selling cases cannot insulate itself from smartphone-market downturns by adjusting its own pricing.
What the Magnitude Tells You
The sign of XED indicates whether two goods are substitutes or complements. The magnitude indicates how closely related they are. Three levels are worth distinguishing.
| XED range | Relationship strength | Typical interpretation | Stylized example |
|---|---|---|---|
| XED > +1 | Strong substitutes | Highly interchangeable goods; price changes in one cause large demand shifts in the other | Generic vs branded medications with same active ingredient |
| 0 < XED < +1 | Weak substitutes | Imperfectly interchangeable; only some consumers switch when prices change | Tea and coffee; beef and chicken |
| XED ≈ 0 | Unrelated | Goods operate in separate markets; price changes have no significant spillover | Toothpaste and mobile data plans |
| −1 < XED < 0 | Weak complements | Loosely consumed together; modest demand spillovers | Cars and gasoline in the short run |
| XED < −1 | Strong complements | Tightly linked goods; one cannot reasonably be consumed without the other | Game consoles and console-exclusive games |
|
Source: MASEconomics editorial synthesis based on standard consumer theory.
|
|||
The thresholds at plus one and minus one matter because they distinguish strong relationships from weak ones. A pair of goods with XED of plus 0.1 is technically classified as substitutes, but the relationship is barely measurable; most consumers do not perceive the two as competing alternatives. A pair with XED of plus 1.5, by contrast, behaves like near-equivalents in the eyes of the market.
Determinants of Cross-Price Elasticity
What determines how strong a substitute or complement relationship is between two goods? Four factors do most of the work.
Functional similarity. Goods that perform the same function for the consumer have a higher positive XED. Two brands of bottled water are highly substitutable because they meet the same need. Bottled water and a luxury watch are not, even though both are products that consumers buy. The closer two goods sit in functional terms, the more sensitively demand for one responds to price changes in the other.
Joint consumption necessity. Goods that must be consumed together to deliver value have a higher negative XED (in absolute terms). Printers and printer ink show this pattern starkly: a printer is useless without ink, and ink purchases collapse if printer sales fall. The same logic applies to game consoles and games, razors and blades, and cameras and lenses. The tighter the requirement that the two goods be used together, the stronger the complement relationship.
Number and quality of alternatives. When many alternatives exist for a substitute relationship, any single pair’s XED tends to be lower because consumer switching is diffused across the alternatives. If the price of one brand of coffee rises, consumers can switch to dozens of other brands, to tea, to energy drinks, or to home brewing methods. No single substitute captures a large share of the displaced demand, so the bilateral XED with any one alternative is modest. In contrast, when only one or two alternatives exist, the bilateral XED with each is high.
Time horizon. Short-run XED is typically smaller than long-run XED, just as with own-price elasticity. Consumers need time to discover alternatives, change purchasing habits, and adjust complementary durable goods. A sudden rise in gasoline prices may produce only a small short-run shift toward fuel-efficient cars (low XED), but the long-run shift over five to ten years is much larger as households eventually replace their vehicles.
Why XED Matters for Business Strategy
Cross-price elasticity is one of the few economic parameters that maps directly onto operational business decisions. Four applications recur across industries.
Competitor identification. Firms often misjudge who their real competitors are. XED estimates resolve the question empirically: a firm’s true competitors are the firms whose price changes affect its own sales, not the firms operating in nominally similar markets. A regional coffee chain may find that its strongest substitute is not another coffee chain but a fast-food breakfast offering. Knowing this changes pricing, location decisions, and product development priorities.
Product bundling. Firms with multiple complementary products in their portfolio can use XED to price them strategically. When two goods are strong complements, pricing one low to drive demand for the other is profitable. The classic example is the razor-and-blade business model: razors are sold below cost or even given away because the complementary blade revenue is reliable and high-margin. Game consoles use the same logic, with consoles sold near cost and the profit captured on games and subscriptions. Identifying the correct complement pair is the precondition for the strategy to work.
Tax incidence and market definition. Antitrust authorities use XED to define competitive markets when evaluating mergers. If two products have a high positive XED, they are part of the same market, and a merger between their producers raises competitive concerns. If XED is low or zero, the products operate in separate markets, and the merger is less problematic. The Hypothetical Monopolist Test used by the US Department of Justice and the European Commission rests on this logic, asking whether a small but significant price increase by a hypothetical merged entity would be defeated by consumer substitution to other products.
Risk management for complement-dependent firms. A company whose revenue depends on a complementary product faces a particular type of exposure. If smartphone sales drop, phone case sales drop. If new car sales drop, sales of aftermarket parts and tires eventually drop. Firms in complement-dependent positions need to model XED exposure as part of their risk management, since their revenue swings with markets they do not directly serve.
The XED in Policy and Regulation
Government policy frequently relies on XED estimates, often without naming the parameter explicitly.
Tax policy spillovers. When a government taxes one good, the effects spill into related markets via XED. A heavy tax on cigarettes has historically been justified partly by the assumption that smokers switch to nicotine substitutes (gum, patches, e-cigarettes), which carry their own public-health profile. The XED between traditional cigarettes and e-cigarettes is one of the most-studied parameters in tobacco regulation, since the answer determines whether cigarette taxes reduce overall nicotine consumption or merely redirect it.
Energy policy. Carbon taxes on gasoline raise the relative price of conventional vehicles and shift demand toward electric vehicles. The size of the shift depends on the XED between the two transportation options. Underestimating this elasticity has led some governments to overestimate the revenue from carbon taxes; overestimating it has produced unrealistic projections of how quickly electric vehicle adoption will respond to price signals.
Healthcare cost containment. Pharmaceutical pricing policy turns on whether branded drugs and generic equivalents are perceived as close substitutes. When XED is high, generic price caps effectively constrain branded drug prices because consumers readily substitute. When XED is low (because of advertising, brand loyalty, or perceived quality differences), the generic policy has less effect on branded prices. The Hatch-Waxman framework in the United States and similar systems elsewhere depend on this substitution mechanism working as intended.
Common Mistakes to Avoid
Three errors recur often enough to flag explicitly.
The first is treating any two goods consumed by the same household as related. Most pairs of goods have XED near zero. A household buys toothpaste and a streaming subscription, but no measurable demand spillover runs between them. The fact that two goods coexist in a budget does not make them economically related.
The second is confusing the direction of XED. XED for good A with respect to the price of good B is not always equal to XED for good B with respect to the price of A. The two measurements can differ in magnitude, especially when the two goods have very different price levels or market sizes. A 10 percent increase in the price of phones has a larger effect on case demand than the reverse, because phones are the larger, more decision-relevant purchase. Empirical XED estimates should always specify which good is in the numerator and which price is in the denominator.
The third is assuming XED is stable over time. Substitute and complement relationships change as products evolve, as new alternatives enter the market, and as consumer preferences shift. Cable television and streaming services had near-zero XED in the early 2000s when streaming barely existed. By the late 2010s, the XED had become strongly positive, with cable subscribers cutting service in response to falling streaming prices. The same logic applies to taxis and ride-sharing, retail bookstores and online vendors, and traditional and digital cameras. Cross-price relationships are dynamic, and historical XED estimates lose relevance as markets evolve.
Explains
Three concepts that organize cross-price elasticity
Continue building your microeconomics foundation with related explainers.
Explore the MASEconomics BlogConclusion
The cross-price elasticity of demand answers a question that the other elasticities cannot: whether two goods are connected in the eyes of the consumer, and if so, how strongly. A positive value identifies substitutes; a negative value identifies complements; a value near zero identifies independence. The sign and magnitude together provide the empirical foundation for competitor identification, product bundling, antitrust market definition, and tax spillover analysis.
The parameter is more context-dependent than the other elasticities. XED depends on what alternatives exist in the consumer’s choice set, how products are bundled, and how preferences evolve over time. Estimates that worked a decade ago may not work today, particularly in markets where digital alternatives have changed the substitution landscape. The conceptual framework, however, is durable. Two goods that move together when one of their prices changes are economically related, regardless of how the relationship looks on the surface. That insight, once captured in a single number, organizes a substantial fraction of applied microeconomic analysis.
Frequently Asked Questions
What is cross-price elasticity of demand?
Cross-price elasticity of demand (XED) measures how the quantity demanded of one good responds to a change in the price of another good. It is calculated as the percentage change in quantity demanded of good A divided by the percentage change in the price of good B. The sign of XED determines whether the two goods are substitutes, complements, or unrelated.
What does a positive cross-price elasticity mean?
A positive XED means the two goods are substitutes. When the price of one rises, demand for the other rises because consumers switch between them. Tea and coffee, Coca-Cola and Pepsi, and beef and chicken are all classic examples. The larger the positive value, the more interchangeable the two goods are in consumer preferences.
What does a negative cross-price elasticity mean?
A negative XED means the two goods are complements, consumed together. When the price of one rises, demand for the other falls because the pair is used jointly. Game consoles and games, cars and gasoline, and printers and ink are common examples. The larger the absolute value, the more tightly the two goods are linked in actual consumption.
How is cross-price elasticity used by businesses?
Firms use XED to identify their true competitors, decide which products to bundle, and assess exposure to related markets. A firm whose XED with another product is high faces direct competition and must price accordingly. A firm with complementary products in its portfolio can price one low to drive demand for the other. Firms whose revenue depends on a complement face risk from price changes in markets they do not directly serve.
Why is cross-price elasticity used in antitrust analysis?
Antitrust authorities use XED to define competitive markets when reviewing mergers. If two products have high positive XED, they belong to the same market and a merger between their producers raises competitive concerns. The Hypothetical Monopolist Test asks whether consumer substitution would defeat a small price increase by a hypothetical merged entity, which is essentially a question about cross-price elasticity in the relevant market.
Can the same two goods be substitutes in some periods and unrelated in others?
Yes. Cross-price elasticity is dynamic and depends on the substitution alternatives available in the market. Cable television and streaming services had near-zero XED in the early 2000s but strongly positive XED by the late 2010s as streaming matured. Taxis and ride-sharing, traditional and digital cameras, and brick-and-mortar bookstores and online vendors show similar patterns. Historical XED estimates often need updating as markets evolve.
Is cross-price elasticity symmetric between two goods?
Not necessarily. The XED for good A with respect to the price of good B can differ from the XED for good B with respect to the price of A. Differences in price level, market size, and decision relevance produce asymmetries. The XED of phone cases with respect to phone prices is typically larger than the reverse, because phones are the larger and more consequential purchase. Empirical XED estimates should always specify which good is in the numerator and which price is in the denominator.
Thanks for reading! If you found this helpful, share it with friends and spread the knowledge. Happy learning with MASEconomics