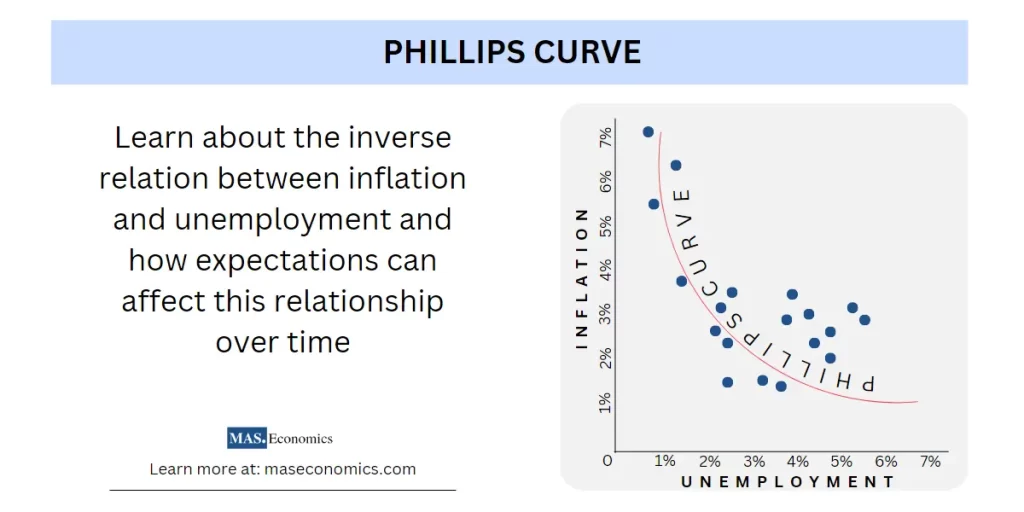
The Phillips curve is an important economic concept that states an inverse relationship between inflation and unemployment. Higher inflation rates lead to lower unemployment levels and vice versa.
While it was a vital tool for macroeconomic policymaking in the 20th century, the stagflation phenomenon of the 1970s – combining high inflation with high unemployment – caused many to doubt its validity.
By considering the role of consumer and worker expectations, however, we can better understand this fundamental relationship between inflation and unemployment.
It may be true that while higher inflation might lead to lower unemployment in the short term, this does not necessarily hold in the long term due to changes in expectations over time. This means policymakers must always remain vigilant when deciding on their macroeconomic frameworks.
History of Phillips Curve
The Phillips curve is one of modern history’s most important economic concepts. It was developed by A.W.H. Phillips in 1958, who had observed an inverse relationship between wages and unemployment in the United Kingdom that lasted for more than a century.
He subsequently hypothesized that the same phenomenon could be found in other countries and surmised that inflation and unemployment were connected inversely.
Since then, economists worldwide have widely adopted the theory as a valuable tool for predicting macroeconomic conditions when setting policy guidelines.
However, many have argued that the correlation described by the Phillips curve can only hold up to a certain extent due to limitations regarding consumer expectations, productivity, or global competition. Furthermore, during the 1970s, the occurrence of stagflation posed a challenge to the validity of the Phillips curve.
In response, policymakers developed newer theories, such as rational expectations theory and natural rate hypothesis, to explain the observed variation in inflation and output. These advances have led to a better understanding of how inflation and output interact.
Today, while some may still dispute the efficacy of the Phillips curve given changing circumstances over time, it remains an integral part of economic history that has shaped our understanding of how macroeconomics works.
Critics of Phillips Curve
Nobel Prize-winning American economist Milton Friedman proposed an alternate explanation for the Phillips curve, now known as the “natural rate hypothesis.” He argued that there is no long-term tradeoff between unemployment and inflation, as initially suggested by Phillips in 1958.
Friedman stated that due to expectations of inflation among workers and businesses, any reduction of unemployment brought about by inflationary policies would be offset by rising wages and eventually lead to an increase in prices which would cause unemployment to return to its natural rate. In other words, Friedman believed that economists had mistakenly assumed a stable tradeoff between unemployment and inflation when there was none.
His views received considerable criticism but have been proven valid by empirical research. His ‘natural rate hypothesis’ is still used today to explain why macroeconomic policy decisions have not always produced the desired effects regarding growth and employment levels.
Open Economy Phillips Curve Model
The Phillips curve model explains how short-term movements in inflation are affected by the output gap, which is the difference between the current output level and its full employment or potential level.
When the output is higher than the potential, firms can increase their profits by increasing prices without worrying about losing sales, and workers will demand higher wages since these costs can be passed on to customers.
As a result, there is an increase in the rate of inflation. Conversely, when there is a negative output gap or high unemployment, prices will decrease, and wage demands will be lower, leading to a decrease in inflation.
Equation (1) describes the short-term link between inflation and the amount of output produced by an economy. In other words, when the production level is higher than expected, then inflation will also increase.

In the more advanced Phillips curve models, the current inflation rate is partially determined by the expected future inflation. If employees anticipate upcoming price rises, they will negotiate with their employers for higher salaries which can then push prices up further. To illustrate this, equation (2) provides an example of the expectations-augmented Phillips curve.
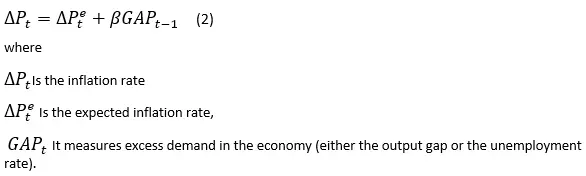
The parameter β illustrates the reaction of inflation to an increase in demand, with a positive sign when the output gap is taken into account and a negative sign when unemployment figures are considered.
Various versions of the Phillips curve model exist, with distinct methods to estimate them. One widespread assumption is that people tend to look backward when it comes to expectations of future inflation – meaning the expected inflation rate is equal to the prior year’s rate. As a result, econometricians use equation (3) to estimate inflation.

For the backward-looking Phillips curve, some researchers include several lags of the inflation rate and ensure all coefficients in the equation add up to one. Furthermore, more recent studies of the Phillips Curve involve expectations for the future, so it is typical to consider both backward and forward elements when creating this model.
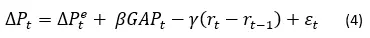
Applying the Phillips curve to open economies assumes that CPI inflation is an average of the inflation rates for domestically produced and imported goods. The Phillips curve determines the rate of domestic production. At the same time, imported goods depend on changes in the real exchange rate and their expected inflation rate – ultimately resulting in equation (4).
The reason behind Flattened Phillips Curve
The Phillips curve has flattened in recent years due to various factors, including globalization. With the increased globalization and labor mobility, the once predictable tradeoff between inflation and unemployment has become unpredictable.
The influx of foreign goods combined with technological innovation has led to a decrease in workers’ bargaining power in countries across the globe, thus resulting in a flattening of the curve.
Furthermore, central banks have also adopted strategies (Inflation Targeting) that keep inflation very low regardless of economic conditions, further contributing to this flattening effect.
Conclusion
The Phillips Curve is an economic theory that provides a valuable framework for understanding how macroeconomic conditions change and affect inflation and unemployment. Despite its critics, the concept has stood the test of time and is still widely accepted among economists. While the original curve did not account for some of the complexities of modern economic systems, further developments such as rational expectations theory and natural rate hypothesis have been able to explain observed variations in inflation and output better. Furthermore, globalization, technological innovation, and central bank policies (Inflation targeting) have all impacted the flattening of the Phillips Curve.