In April 2026, the New York Fed reported that one-year-ahead household inflation expectations rose to 3.6 percent, while three-year and five-year expectations stayed at 3.1 percent and 3.0 percent. Inflation expectations matter because future price beliefs affect wage bargaining, price setting, saving decisions, bond yields, and the credibility of monetary policy.
The Federal Reserve treats expectations as part of the inflation process itself. Its 2025 longer-run strategy statement says that longer-term inflation expectations anchored at 2 percent support price stability, moderate long-term interest rates, and strengthen the Fed’s ability to promote maximum employment during shocks.
Core definition: Inflation expectations are beliefs about the future inflation rate. They can come from households, firms, professional forecasters, or financial markets, and they matter because expected inflation can influence current wage contracts, price markups, borrowing costs, and central bank credibility.
Beliefs Inside the Inflation Process
Inflation expectations are not the same as actual inflation. Actual inflation measures the price change that has already occurred. Expected inflation measures what households, firms, investors, and forecasters think will happen next. The gap between the two is often where policy tension begins.
When a household expects higher inflation, it may bring purchases forward, demand higher wages, or become more sensitive to visible prices such as food, rent, gasoline, and utilities. When firms expect higher input costs, they may raise prices before costs fully arrive. When bond investors expect higher future inflation, they demand compensation through higher nominal yields. These decisions do not mechanically create inflation, but they can make price shocks more persistent.
The Federal Reserve’s 2 percent inflation objective is written in terms of the personal consumption expenditures price index. Yet inflation expectations are monitored across several measures because no single series captures the whole economy. Household surveys capture the lived price pressure. Professional forecasts capture model-based judgment. Market-implied measures capture compensation embedded in Treasury and inflation-protected securities. Central banks watch all three because each can fail in a different way.
The distinction is clear in the 2026 data. The Bureau of Labor Statistics reported that CPI inflation rose 3.8 percent over the 12 months ending April 2026, while core CPI rose 2.8 percent. The New York Fed Survey of Consumer Expectations showed one-year inflation expectations at 3.6 percent in April 2026, while three-year and five-year expectations stayed lower. The short-run series moved with near-term price pressure. The longer-run series remained closer to the credibility anchor.
Adaptive and Rational Expectations
Economic theory separates expectations into several formation rules. The two classic cases are adaptive expectations and rational expectations. They are not competing labels for the same idea. They describe different assumptions about how people process information.
Adaptive expectations assume that people update beliefs using past forecast errors. If inflation was higher than expected last period, expected inflation rises this period. If inflation is lower than expected, expected inflation falls. The adjustment is gradual, so inflation can become persistent when recent inflation stays high.
In this equation, \( \pi_t^e \) is expected inflation for period \( t \), \( \pi_{t-1}^e \) is last period’s expected inflation, \( \pi_{t-1} \) is last period’s actual inflation, and \( \lambda \) is the speed of adjustment. A high \( \lambda \) means expectations respond quickly to surprises. A low \( \lambda \) means expectations adjust slowly.
Rational expectations assume that people use all available information and the structure of the economy to forecast inflation. Forecasts can still be wrong because shocks are uncertain. The key claim is that forecast errors should not be systematically predictable using information already available when the forecast was made.
Here, \( E_{t-1} \) is the expectation formed before period \( t \), and \( \Omega_{t-1} \) is the information set available at that time. Under rational expectations, predictable policy patterns matter because households, firms, and markets incorporate them into current decisions. That is why the rational expectations revolution changed macroeconomics and why the future Stream B article on the Lucas Critique should link back to this article.
Modern inflation models often combine both elements. In the New Keynesian Phillips Curve, expected inflation affects current inflation because firms set prices with a view to future costs and demand. Backward-looking behaviour also matters when wage contracts, indexation, habit formation, or credibility problems make past inflation persistent. This is the bridge between inflation expectations and the future Stream B article on inflation persistence.
The flow diagram below shows how backward-looking information, forward-looking news, and central bank credibility combine to form expected inflation before feeding into wages, prices, and financial markets.
Survey, Market, and Forecast Measures
Inflation expectations are measured from different groups because each group answers a different economic question. Household expectations are important for consumption, wage demands, and political pressure. Firm expectations are important for price setting and investment plans. Professional forecasts are useful because they aggregate model-based analysis. Market-implied expectations matter because they enter asset prices and borrowing costs.
The University of Michigan Surveys of Consumers provide a long-running household series for one-year and longer-run inflation expectations. FRED reports the Michigan one-year expected inflation series at 3.8 percent in March 2026, with the latest value hidden under the source agreement. The survey’s May 2026 preliminary release showed consumer sentiment at 48.2, reflecting weak household confidence during a period of renewed price pressure.
The New York Fed’s Survey of Consumer Expectations adds a richer structure because it reports one-year, three-year, and five-year horizons. In April 2026, the one-year measure rose to 3.6 percent, while the three-year and five-year measures were unchanged at 3.1 percent and 3.0 percent. That pattern is useful. It shows near-term concern without a full loss of longer-term anchoring.
The Survey of Professional Forecasters, run by the Philadelphia Fed, captures forecasts from professional forecasters. In the second quarter of 2026, the SPF expected headline CPI inflation to average 3.5 percent in 2026 on a fourth-quarter over fourth-quarter basis. Yet the 10-year annual-average CPI projection was 2.40 percent and the corresponding PCE projection was 2.22 percent. Short-run inflation was marked up, but the long-run projection remained close to the Fed’s target.
Market measures are different. The five-year, five-year forward inflation expectation rate is derived from Treasury and inflation-protected securities. FRED describes it as expected inflation over the five-year period that begins five years from the observation date. The monthly FRED series stood at 2.17 percent in April 2026. Market measures are useful because money is at stake, but they include risk premia and liquidity effects. They should not be read as pure forecasts.
| Measure | Source | Horizon | Latest 2026 signal | Main interpretation |
|---|---|---|---|---|
| Michigan consumer expectations | University of Michigan | One year and longer run | One-year FRED value: 3.8% in Mar. 2026 | Household cost-of-living beliefs |
| Survey of Consumer Expectations | New York Fed | One, three, and five years | 3.6%, 3.1%, and 3.0% in Apr. 2026 | Household expectations across horizons |
| Survey of Professional Forecasters | Philadelphia Fed | Current quarter to 10 years | 10-year PCE projection: 2.22% in Q2 2026 | Model-based professional forecast anchor |
| Five-year, five-year forward rate | FRED / Treasury market data | Five years beginning five years ahead | 2.17% in Apr. 2026 | Market-implied long-run compensation |
| Firm expectations | Regional Fed business surveys | Usually one year | Survey-specific | Price-setting and wage-setting channel |

|
||||
Anchoring and the Two Percent Target
An expectation is anchored when it does not move sharply after temporary inflation news. If gasoline prices rise for one month and one-year expectations rise, that may be a normal response to a visible shock. If five-year, 10-year, and market-implied measures also rise sharply, the central bank faces a deeper credibility problem.
The Fed’s strategy statement makes this connection explicit. It states that longer-term expectations anchored at 2 percent foster price stability and moderate long-term interest rates. The word “anchored” does important work. It means that the public believes temporary inflation shocks will not permanently change the long-run inflation regime.
The anchoring idea explains why central banks respond differently to short-run and long-run expectation movements. A temporary rise in one-year expectations can reflect energy prices, food prices, or a tax shock. A broad rise in five-year expectations, professional long-run forecasts, and forward breakevens suggests that private agents are revising their view of the monetary regime itself.
Anchoring also explains why expectations are central to inflation targeting. A target is not only a number in a policy statement. It is a coordination device. If households, firms, and markets believe the central bank will return inflation to target, wage and price decisions are less likely to embed a temporary shock into a lasting inflation process.
The 2021-2024 inflation episode showed this distinction. Actual inflation rose sharply, and short-run expectations moved with it. Longer-run expectations rose less. That difference helped the Fed argue that inflation was too high but not yet fully unanchored. The policy risk was that the longer the overshoot lasted, the greater the chance that short-run price experience would change long-run beliefs.
Expectations in Wages and Prices
Expectations enter inflation through several practical channels. Wage contracts are one channel. If workers expect higher inflation, they may demand higher nominal wages to protect real purchasing power. If firms grant those wage increases and pass costs into prices, inflation can become more persistent.
Price setting is another channel. Firms do not set prices only from yesterday’s cost data. They also form views about future demand, input costs, competitor behaviour, and central bank policy. A firm expecting broad cost increases may raise prices pre-emptively. A firm expecting credible disinflation may absorb temporary costs rather than reset prices repeatedly.
Financial contracts add a third channel. Nominal interest rates include expected real returns, expected inflation, and risk premia. If expected inflation rises, long-term nominal rates can rise even before actual inflation changes. That affects mortgage rates, corporate borrowing costs, equity valuation, and the transmission of monetary policy.
The relationship with the Phillips Curve is direct. A traditional expectations-augmented Phillips Curve can be written as:
In this expression, \( \pi_t \) is actual inflation, \( \pi_t^e \) is expected inflation, \( y_t – y_t^* \) is the output gap, and \( u_t \) is a supply shock. If expected inflation rises, actual inflation can rise even without a larger output gap. This is why central banks treat expectations as a state variable, not a side issue.
The same logic connects to economic slack in inflation prediction. When expectations are stable, slack can help forecast inflation because demand pressure affects price setting at the margin. When expectations are unstable, the Phillips Curve can shift. The same unemployment rate may then be associated with a different inflation rate.
Expectations Versus Actual Inflation
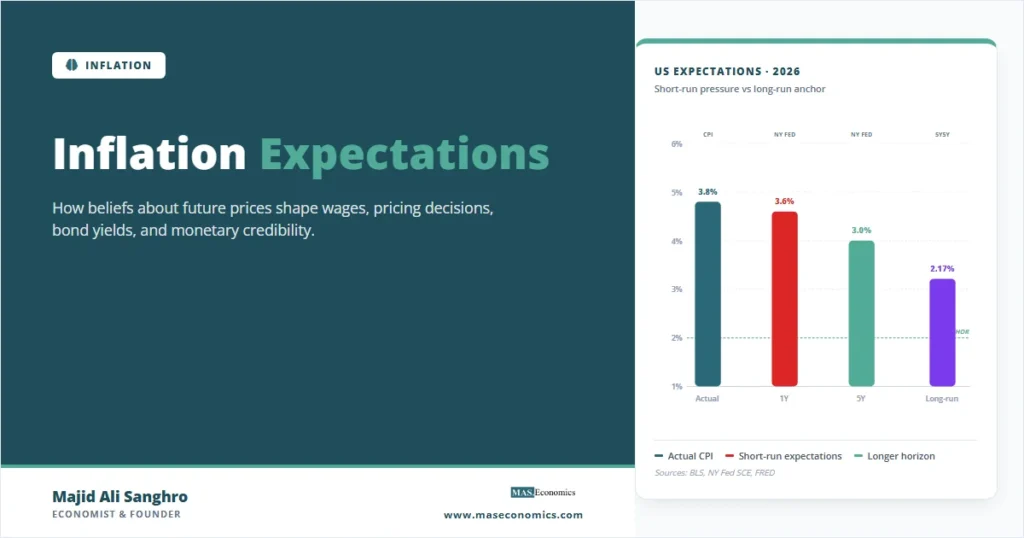
The chart below places actual CPI inflation next to household, professional, and market-implied expectations. The purpose is not to claim that each series measures the same object. It shows how different horizons react to the same inflation environment.
The April 2026 data show the standard pattern. Actual CPI inflation was elevated at 3.8 percent. Near-term household expectations were also elevated, with the New York Fed one-year measure at 3.6 percent. Professional long-run PCE expectations and market-implied forward inflation were much lower, near the low 2 percent range. That gap is the anchor story: short-run inflation stress remained visible, while long-run expectations had not fully broken away from the 2 percent policy regime.
This distinction matters for central banking and monetary policy. If the central bank tightens policy only because one-year expectations rise after a fuel shock, it may overreact to relative-price volatility. If it ignores a broad rise in long-run expectations, it may allow credibility to weaken. The correct response depends on horizon, source, and persistence.
When Expectations Mislead
Inflation expectations are important, but they are not perfect forecasts. Household expectations often respond strongly to visible prices. Gasoline, groceries, rent, and utilities are more salient than the full consumption basket. This can make household expectations move more than professional forecasts after energy or food shocks.
Market-based measures also have limitations. Breakeven inflation rates are affected by liquidity conditions, risk premia, tax treatment, and changing demand for safe assets. A fall in breakevens during a financial crisis may reflect market stress rather than a clean decline in inflation expectations. A rise may reflect risk compensation rather than a pure inflation forecast.
Professional forecasts can be slow to adjust around turning points. They aggregate model-based judgment, but models often rely on historical relationships. When the economy shifts regime, as it did during the pandemic and the later supply-shock period, professional forecasts can understate near-term inflation risk.
The measurement lesson is simple. No expectations series should stand alone. Household, professional, and market measures need to be read together with actual inflation, wages, labour-market tightness, supply shocks, and central bank communication. This is also why articles on the causes of inflation, the Consumer Price Index, and inflation simply explained should link back to expectations as a separate mechanism.
MASEconomics Explains
4 economic concepts behind inflation expectations
These concepts are explored in depth across our educational articles library.
Explore the MASEconomics BlogConclusion
Inflation expectations are a central part of inflation dynamics because beliefs about future prices shape wage bargaining, price setting, interest rates, and monetary-policy credibility. The 2026 data show why horizon matters: actual CPI inflation and one-year household expectations remained elevated, while professional long-run projections and market-implied forward inflation stayed closer to the Federal Reserve’s 2 percent framework. Expectations are therefore not a single number. They are a dashboard for judging whether inflation pressure is temporary, persistent, or becoming embedded in the policy regime.
Frequently Asked Questions
What are inflation expectations?
Inflation expectations are beliefs about future inflation. They can be measured from households, firms, professional forecasters, and financial markets. Central banks monitor them because expected inflation can affect current wage demands, price setting, and interest rates.
Why do inflation expectations matter?
They matter because people act on price beliefs before future inflation arrives. Workers may bargain for higher wages, firms may raise prices earlier, and investors may demand higher nominal yields. These responses can make inflation more persistent.
How are inflation expectations measured?
They are measured through surveys and financial markets. Common examples include the University of Michigan Surveys of Consumers, the New York Fed Survey of Consumer Expectations, the Philadelphia Fed Survey of Professional Forecasters, and Treasury market breakeven inflation rates.
What does anchored inflation mean?
Anchored inflation expectations mean longer-run beliefs remain close to the central bank’s target after temporary shocks. For the Federal Reserve, the relevant anchor is 2 percent inflation measured by PCE over the longer run.
Are inflation expectations always accurate?
No. Household expectations can overreact to visible prices such as gasoline and groceries. Market-based expectations include risk and liquidity premia. Professional forecasts can miss regime shifts, so expectations should be read as signals rather than perfect predictions.
Thanks for reading! If you found this helpful, share it with friends and spread the knowledge. Happy learning with MASEconomics