The causes of inflation have been studied formally for more than a century, and the 2021-2024 global price surge revived almost every theoretical position once thought settled. Year-on-year US PCE inflation peaked at 7.2 percent in June 2022, while core PCE hit 5.6 percent in February of the same year, the highest readings since 1981, per data published by the Federal Reserve Bank of St. Louis. Different schools of thought offer different explanations, and the policy implications of each diverge sharply.
Three broad questions organise the literature. Is inflation a monetary phenomenon, a fiscal phenomenon, or both? Do supply shocks cause inflation directly, or only when monetary policy accommodates them? And do inflation expectations make the entire process self-perpetuating, or are they passive responses to actual price changes? The economists profiled below each answered some part of these questions, and their answers became the foundation for every modern central bank framework.
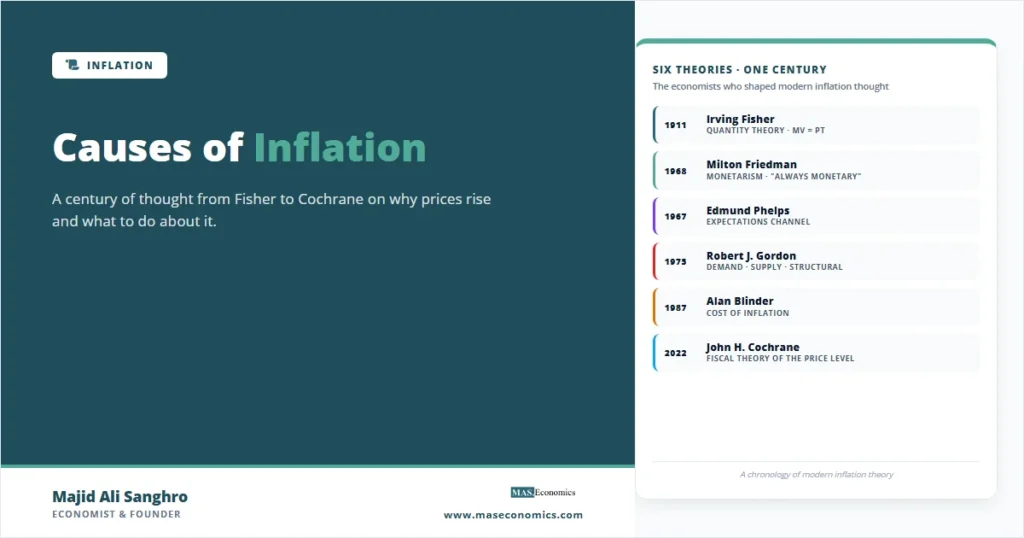
Six Causes Across a Century of Theory
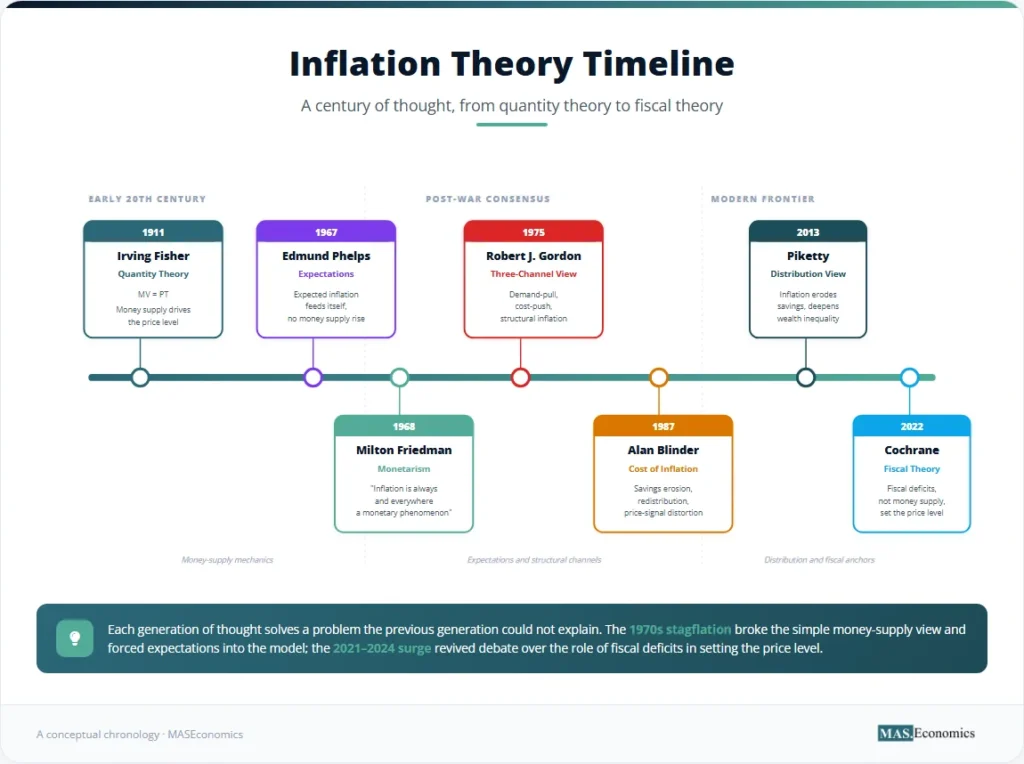
Inflation is a sustained increase in the general price level, but the mechanisms that drive it have been explained in markedly different ways across the past century. Irving Fisher built the first formal equation in 1911. Milton Friedman placed monetary growth at the centre in the 1960s. Edmund Phelps inserted expectations into the picture before the stagflation of the 1970s arrived to prove that the simple money-quantity story was incomplete. Robert J. Gordon broke the modern taxonomy into demand-pull, cost-push, and structural components. Alan Blinder enumerated the costs. Thomas Piketty connected inflation to wealth distribution. And John Cochrane, writing through the 2021-2024 surge, revived a fiscal theory of the price level that places government deficits rather than central bank balance sheets at the centre of inflation determination. The chronology that follows traces that arc.
Fisher and the Quantity Theory of Money
Irving Fisher formalised the relationship between money and prices in 1911 through the equation of exchange. The identity states that the money supply multiplied by the velocity of money equals the price level multiplied by the volume of transactions, conventionally written as MV = PT. Where M is the money stock, V is the average number of times each unit of money changes hands, P is the price level, and T is the real volume of transactions.
Fisher’s empirical claim was that V was relatively stable across short horizons because it reflected technological and institutional features of the payments system rather than discretionary choices. If V is stable and T grows at a rate determined by productive capacity, then changes in M translate one-for-one into changes in P over the medium term. The Quantity Theory thus predicts a direct, durable link between monetary expansion and inflation, and it gave central banks the conceptual basis for using money-supply growth as a policy target. The framework dominated academic thinking from Fisher through the mid-twentieth century and remains the starting point for every introductory treatment of price-level measurement.
Friedman: Inflation Is Always a Monetary Phenomenon
Milton Friedman extended and modernised the Quantity Theory across the 1960s and 1970s. His 1968 American Economic Association presidential address and the work that surrounded it produced the most-quoted sentence in twentieth-century macroeconomics: inflation is always and everywhere a monetary phenomenon, in the sense that it can be produced only by a more rapid increase in the quantity of money than in output. Friedman drew the implication that long-run inflation control depends on disciplined money-supply growth, not on the wage and price controls that several governments were experimenting with at the time.
Friedman’s framework drew on Fisher’s Quantity Theory but added two features. The first was the natural rate of unemployment, a level below which attempts to push unemployment further would only produce accelerating inflation. The second was the central role of expectations, which Friedman developed in parallel with Phelps and which became the bridge between the monetary view and the modern New Keynesian framework. The Friedman-Phelps natural rate hypothesis is treated separately in our natural rate piece.
Phelps and the Expectations Channel
Edmund Phelps published the foundational expectations-augmented Phillips Curve in 1967, one year ahead of Friedman’s address. Phelps argued that workers and firms set wages and prices based on expected inflation, not just current inflation. If expectations rise, then nominal wage demands rise and firms validate them by raising prices, producing actual inflation without any prior change in the money supply. The mechanism is self-reinforcing because realised inflation feeds back into next period’s expectations.
The Phelps-Friedman expectations hypothesis produced a policy implication that broke the post-war consensus: there is no long-run trade-off between inflation and unemployment, because once expectations adjust, any inflation rate is consistent with the natural rate of unemployment. The 1970s, when high inflation and high unemployment coexisted, falsified the simple Phillips Curve and vindicated Phelps. Inflation expectations have remained at the centre of central bank communication ever since. The expectations channel also forms the modern explanation of the Phillips Curve and the foundation of the New Keynesian Phillips Curve.
Gordon: Demand-Pull, Cost-Push, and Structural
Robert J. Gordon’s 1975 work on inflation provided a working taxonomy that survives in central bank discussions to this day. Gordon decomposed inflation into three components: demand-pull, cost-push, and structural. Demand-pull inflation arises when aggregate demand exceeds productive capacity, typically through fiscal expansion or accommodative monetary policy. Cost-push inflation arises when input costs rise (energy, raw materials, wages) and firms pass them forward into final prices. Structural inflation reflects market rigidities such as monopoly power or wage indexation that prevent prices from falling even when demand cools.
The Gordon framework was important because it allowed multiple mechanisms to operate at once. The 1973 oil shock was a cost-push event; the late-1960s Vietnam War expenditure was demand-pull; the wage indexation systems in France and Italy were structural. Modern central banks routinely decompose monthly inflation prints into demand- and supply-driven components using Gordon’s logic. The forthcoming Stream B article on Cost-Push vs Demand-Pull develops this decomposition formally; the present discussion of the cost-push channel connects directly to historical experience documented in our 1970s Great Inflation cross-country comparison.
Barro on Inflation and Growth
Robert Barro shifted the question in the late 1970s from what causes inflation to what inflation does. His NBER work on inflation and growth showed empirically that sustained high inflation reduces real GDP growth, with a stronger effect at higher inflation rates. The mechanism operates through three channels: uncertainty that suppresses long-horizon investment, distortion of relative price signals that misdirects resource allocation, and erosion of the real return on nominal savings instruments that biases the savings-investment balance.
Barro’s empirical claim has been replicated across most subsequent cross-country studies. The growth penalty is modest at single-digit inflation rates and severe above 20 percent annually. The implication is that inflation control is not just a price-stability objective but a growth objective, which became the standard justification for the inflation-targeting framework adopted by the Reserve Bank of New Zealand in 1990 and by every major central bank since.
Blinder and the Cost of Inflation
Alan Blinder’s 1987 work catalogued the welfare costs of inflation more systematically than any predecessor. Blinder identified five categories. Erosion of nominal savings reduces real wealth when inflation outpaces nominal interest rates. Redistribution from creditors to debtors transfers wealth based on the unexpected component of inflation rather than on productive activity. Increased uncertainty raises risk premiums in long-term contracts and depresses investment. Distortion of relative prices makes it harder for firms to read demand signals. And menu costs, the resources spent updating prices, multiply by the inflation rate.
The Blinder cost framework is the modern justification for why central banks target 2 percent rather than 0 percent or 5 percent. The optimum is small and positive: enough to lubricate relative-price adjustment without imposing the welfare costs that Blinder catalogued. The greenflation and supply-shock literature of the past five years has revived debate over whether 2 percent is too low or about right, and our discussion of green energy policy and inflation picks up that thread.
Piketty: Inflation and Wealth Distribution
Thomas Piketty’s 2013 work returned attention to a feature of inflation that had been underweighted in the post-Friedman literature: its distributional consequences. Piketty’s framework places the rate of return on capital (r) above the rate of economic growth (g) over long horizons, producing a tendency for wealth to concentrate among capital owners. Inflation interacts with this tendency in two opposing ways. Unexpected inflation reduces the real value of nominal debt, which can transfer wealth from creditors (often the wealthy) to debtors (often middle-income households). But sustained inflation also erodes the real value of nominal savings, which falls more heavily on lower-income households who hold a larger share of their wealth in cash and bank deposits rather than in real assets.
The net distributional effect is empirically ambiguous, and the 2021-2024 surge produced active debate over whether it had widened or narrowed wealth inequality in the United States. The asset-price-versus-consumer-price gap is one important dimension of this question, treated separately in our asset price inflation analysis.
Five Schools and What They Argue
The chronological treatment above can be reorganised by school of thought. Each modern school carries forward a distinct answer to the causes-of-inflation question, with distinct policy implications. The table below sets out the five major positions.
| School | Lead Cause | Key Champion | Policy Implication | Modern Standing |
|---|---|---|---|---|
| Monetarist | Money supply growth above output growth | Friedman, Fisher | Control monetary aggregates; rules over discretion | Foundational; superseded by interest-rate targeting |
| Keynesian / Demand-Pull | Aggregate demand exceeds capacity | Keynes, Samuelson | Fiscal restraint and rate hikes when overheating | Embedded in every modern policy framework |
| New Keynesian | Expectations + sticky prices + output gap | Phelps, Gali, Woodford | Anchor expectations through credible inflation target | Dominant academic framework; basis of FOMC models |
| Fiscal Theory of the Price Level | Government deficits set the nominal anchor | Cochrane, Sims, Leeper | Fiscal sustainability is the real inflation control | Revived sharply by the 2021-2024 surge |
| Supply-Side / Cost-Push | Input costs and supply chain shocks | Gordon, Bernanke-Blanchard | Look through transitory shocks; act if expectations move | Centre-stage in 2022 energy episode |

|
||||
The five schools are not mutually exclusive. Most contemporary central bank frameworks combine New Keynesian core machinery (sticky prices, expectations channel, output gap) with explicit accommodation of supply-side shocks and an implicit assumption of fiscal sustainability. The Cochrane fiscal theory sits outside this mainstream but has gained ground since 2022 because the simple New Keynesian framework struggled to explain why the 2021 inflation acceleration began before any output-gap closure and persisted longer than the model implied.
Decomposing the 2021-2024 Surge
The framework debate became concrete in the 2021-2024 surge. The Federal Reserve Bank of St. Louis and a parallel study by Ben Bernanke and Olivier Blanchard decomposed US PCE inflation into demand-driven, supply-driven, and expectations-driven contributions across the cycle. The chart below shows the decomposition by quarter from 2019 through 2025.
Two findings from the decomposition shape the current debate. First, supply-side contributions peaked at roughly 3.4 percentage points in 2022 Q2, larger than the demand contribution at that point, supporting the Bernanke-Blanchard reading that supply shocks were the proximate cause of the initial spike. Second, supply contributions collapsed quickly through 2023-2024 while demand and expectations contributions decayed more slowly, which is why disinflation in the second half of the cycle was slower than the simple supply-shock view predicted. Modern interpretations of the greedflation debate sit within the demand-contribution bar, since pricing power and markup behaviour are a sub-channel of how demand pressure passes through to final prices.
The April 2026 inflation data illustrate how rapidly the supply contribution can reactivate. US headline CPI jumped to 3.8 percent year-on-year from 2.7 percent in 2025, with energy contributing more than 40 percent of the monthly gain on Middle East supply concerns. The euro area saw the same dynamic, with HICP energy inflation rising to 10.9 percent year-on-year and headline HICP climbing to 3.0 percent. Both episodes are cost-push events in the Gordon framework, layered on top of an otherwise disinflating economy. The persistence of any expectations pass-through into 2026 wage and price setting is the variable that will determine whether the April spike remains a one-off shock or becomes the start of a second-round dynamic of the kind Phelps and Friedman first formalised in 1967-1968.
The Cochrane Fiscal Theory Revival
John Cochrane’s fiscal theory of the price level received its most visible test during the 2021-2024 surge. Cochrane argues that the price level adjusts to make the real value of government debt equal to the present value of expected future primary surpluses. In ordinary times, this constraint is slack because deficits are temporary and surpluses are expected to follow. But when fiscal authorities run sustained large deficits with no credible path back to surplus, the price level must rise to reduce the real value of the outstanding debt stock. The Federal Reserve’s interest-rate decisions, on this view, redistribute the timing of inflation across periods but cannot prevent it.
The empirical case for the fiscal view rests on three observations. US federal deficits ran above 10 percent of GDP in 2020-2021, the largest peacetime expansion in modern history. Money-supply measures grew rapidly but unevenly across countries, while every advanced economy with a comparable fiscal expansion experienced comparable inflation, regardless of the central bank’s balance-sheet path. And the 2023-2024 disinflation arrived alongside fiscal moderation and supply-chain normalisation rather than as a clean monetary policy result. The fiscal theory remains contested and is not the dominant framework at any major central bank, but it has shifted the discussion enough that government policies that drive inflation are now treated as first-order rather than second-order factors in most modern surveys.
MASEconomics Explains
Four economic concepts behind the causes of inflation
These concepts are explored in depth across our educational articles library.
Explore the MASEconomics BlogConclusion
The causes of inflation have been answered differently by every generation of economic thought, and the 2021-2024 surge revived almost all of those answers. Fisher and Friedman placed money supply at the centre, Phelps inserted expectations, Gordon decomposed inflation into demand-pull, cost-push, and structural channels, Barro documented the growth penalty, Blinder catalogued the welfare costs, Piketty highlighted the distributional consequences, and Cochrane reasserted fiscal deficits as the ultimate anchor of the price level. Modern central bank frameworks combine the New Keynesian core (sticky prices, expectations, output gap) with explicit accommodation of supply shocks and an implicit assumption that fiscal authorities will maintain solvency. The empirical decomposition of the post-pandemic surge supports a mixed reading: supply shocks drove the initial spike, demand pressure sustained it, expectations remained anchored well enough to permit a relatively rapid disinflation, and fiscal moderation contributed to the closing phase. None of the historical theories has been falsified outright; each captures one channel that operates more strongly under some conditions than others.
Frequently Asked Questions
What are the main causes of inflation?
Modern macroeconomics identifies four interacting channels: demand-pull pressure when aggregate demand exceeds productive capacity, cost-push pressure when input costs rise and pass through to final prices, expectations dynamics when anticipated inflation feeds into wage and price setting, and structural factors such as market rigidities and import dependence. Most real-world episodes combine two or more of these channels rather than operating through a single cause.
Who is the most famous economist on inflation?
Milton Friedman is the most cited modern authority on inflation through his 1968 American Economic Association presidential address and the line “inflation is always and everywhere a monetary phenomenon.” Irving Fisher developed the foundational Quantity Theory of Money in 1911. Edmund Phelps shared the 2006 Nobel Prize partly for his work on expectations and the natural rate, and John Cochrane has led the modern revival of the fiscal theory of the price level since 2022.
What is the difference between demand-pull and cost-push inflation?
Demand-pull inflation arises when aggregate demand exceeds the economy’s productive capacity, typically through fiscal expansion or accommodative monetary policy. Cost-push inflation arises when input costs (energy, raw materials, wages) rise and firms pass those increases forward through higher final prices. Demand-pull episodes are usually accompanied by output expansion and falling unemployment; cost-push episodes can produce stagflation, with rising prices and weakening growth at the same time.
Did money printing cause the 2021-2024 inflation?
The empirical evidence is mixed. The Federal Reserve’s balance sheet expanded sharply through 2020-2021, but money-supply growth alone does not match the cross-country pattern of inflation outcomes. Most decompositions, including Bernanke-Blanchard (2023) and St. Louis Fed (2025), attribute the initial spike primarily to supply shocks, with demand pressure sustaining it and expectations remaining anchored. The fiscal theory view associated with John Cochrane attributes a larger share of the surge to the USD 5 trillion in pandemic-era deficits.
Why do central banks target 2 percent inflation?
A small positive inflation rate lets central banks cut real interest rates below zero in downturns, allows relative price adjustment without forcing nominal wage cuts, and provides a buffer against deflation, which is harder to escape than inflation. The 2 percent figure was first formalised by the Reserve Bank of New Zealand in 1990 and has since been adopted by the Federal Reserve, the ECB, the Bank of England, and most major central banks. The Blinder cost framework provides the welfare-economics justification for why the optimum is small and positive rather than zero.
Thanks for reading! If you found this helpful, share it with friends and spread the knowledge. Happy learning with MASEconomics