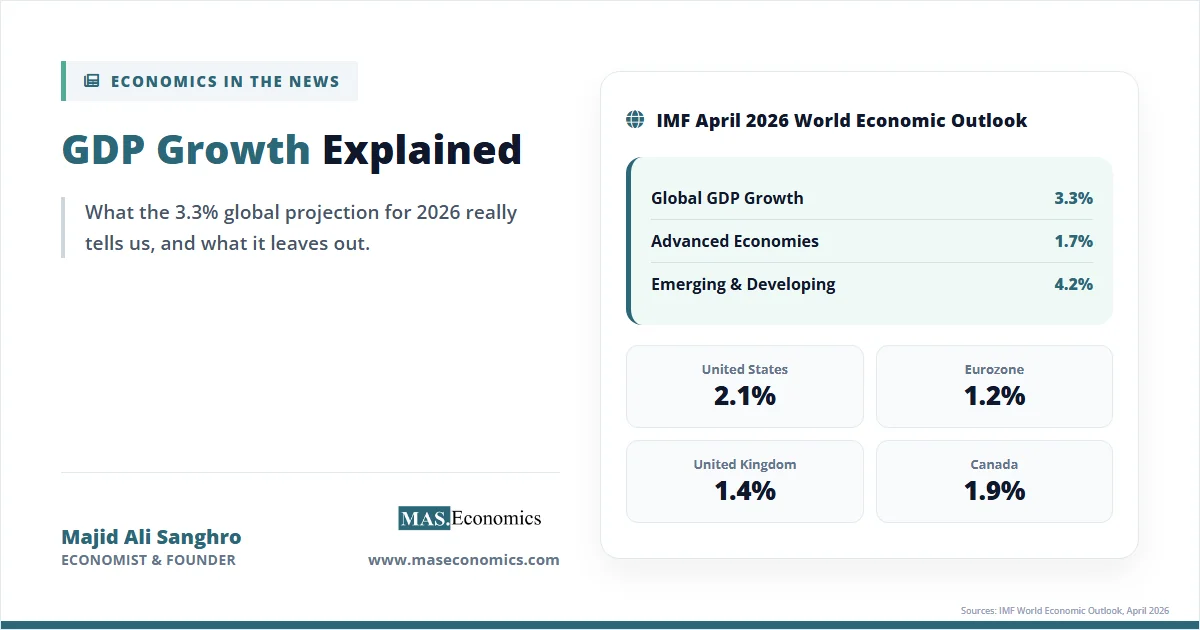
The International Monetary Fund’s April 2026 World Economic Outlook projects global GDP growth of 3.3 percent for the year, a figure that continues a pattern of modest expansion following the turbulent 2020–2025 period. Headline numbers of this kind dominate financial news and shape policy decisions across the world’s major economies. Yet the summary statistic conceals as much as it reveals. Understanding what GDP growth actually measures, and critically what it excludes, is essential for interpreting the health of any national economy. GDP growth explained reveals what the measure captures and what it omits.
Global GDP in 2026
The IMF’s April 2026 forecast places global output at approximately $118 trillion in nominal terms, with advanced economies expanding at 1.7 percent and emerging and developing economies at 4.2 percent. The United States is expected to grow 2.1 percent, the Eurozone 1.2 percent, the United Kingdom 1.4 percent, and Canada 1.9 percent. These figures, while positive, mask substantial variation beneath the surface. Some sectors, particularly technology and energy, are expanding rapidly, while manufacturing and real estate face persistent headwinds. Also, the aggregate growth number says nothing about how the gains from that expansion are distributed across households, nor does it account for the depletion of natural resources or the value of unpaid care work. The gap between what GDP captures and what constitutes genuine economic well‑being is the central theme of any rigorous GDP growth analysis.
History of GDP Measurement
Gross Domestic Product emerged as a systematic measure during the 1930s and 1940s, largely through the work of economist Simon Kuznets, who developed the first national income accounts for the United States. Kuznets himself warned against using GDP as a welfare measure, noting that “the welfare of a nation can scarcely be inferred from a measurement of national income.” (Kuznets, 1934) Despite this caution, the metric became the global standard following the Bretton Woods Conference of 1944, which established the International Monetary Fund and the World Bank and required member nations to report standardized economic data.
The post‑war decades saw the refinement of national accounting frameworks. The System of National Accounts (SNA), first published in 1953 and updated regularly by the United Nations, provides the international guidelines that ensure comparability across countries. The 2008 SNA introduced important changes, including the capitalization of research and development spending and the treatment of intellectual property products. These revisions added trillions of dollars to measured GDP in advanced economies without any actual change in underlying economic activity, a reminder that GDP is a constructed, evolving measure rather than an objective fact.
The 2020–2025 period tested the limits of GDP as a real‑time indicator. The COVID‑19 pandemic caused the sharpest quarterly contractions on record, with global GDP falling 3.1 percent in 2020 according to World Bank data. The subsequent recovery was equally dramatic, with 2021 growth reaching 6.2 percent. Such extreme swings revealed the sensitivity of GDP to policy interventions and temporary shocks, while also showing its inability to capture the human costs of lockdowns or the value of public health measures.
What GDP Actually Measures
Gross Domestic Product quantifies the total market value of all final goods and services produced within a country’s borders during a specific period, typically a quarter or a year. Three equivalent approaches exist for calculating GDP, though the expenditure method is most commonly referenced in policy discussions.
The Expenditure Approach decomposes GDP into four components:
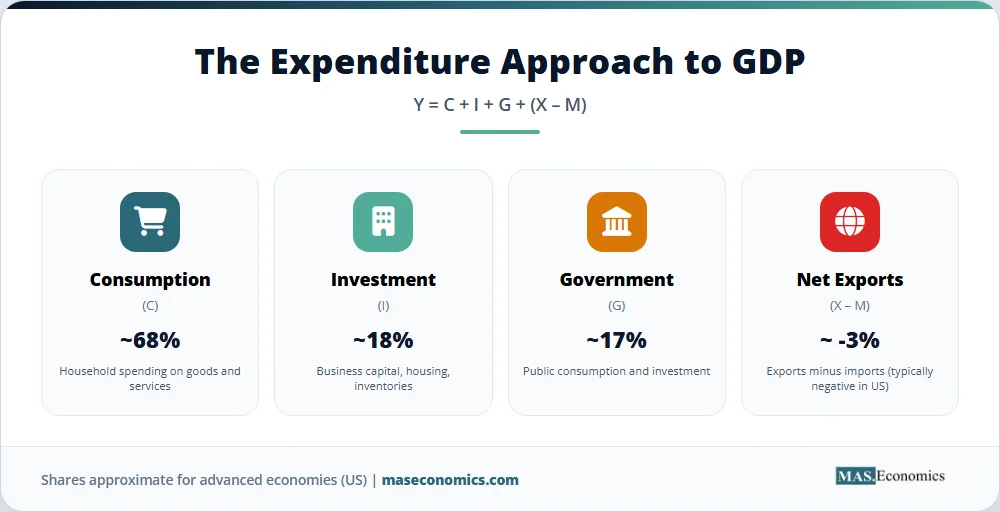
Each term represents a distinct source of spending. Consumption (C) is household spending on goods and services, everything from groceries and rent to movie tickets and haircuts. In advanced economies, consumption usually accounts for 60–70 percent of total GDP. Investment (I) is business spending on capital equipment, such as machinery, factories, and software, plus residential construction and changes in business inventories. Investment is the most volatile component, swinging sharply with business confidence. Government spending (G) includes public sector consumption and investment: salaries of public employees, military hardware, infrastructure projects, and public services. It excludes transfer payments like Social Security or unemployment benefits, which merely shift income rather than produce new output. Net exports (X – M) subtract imports from exports. Imports are subtracted because they represent spending on goods produced abroad; exports are added because they represent foreign spending on domestic production.
The Income Approach sums all earnings from production: wages and salaries paid to workers, corporate profits retained or distributed, interest income earned by lenders, rental income from property, and taxes less subsidies. In principle, every dollar spent by someone becomes a dollar earned by someone else, so expenditure and income measures should match. In practice, statistical discrepancies always arise from measurement errors and timing differences.
The Production Approach (or value‑added approach) sums the value added at each stage of production across all industries. Value added is the difference between a firm’s sales and the cost of intermediate goods it purchases from other firms. This method avoids double‑counting: if a farmer sells wheat to a miller for $100, the miller sells flour to a baker for $200, and the baker sells bread to a consumer for $300, the total value added is $100 (farmer) + $100 (miller) + $100 (baker) = $300, which equals the final price of the bread. The production approach is especially useful for understanding the structure of an economy and which sectors contribute most to growth.
A crucial distinction exists between nominal GDP and real GDP. Nominal GDP measures output at current market prices. If prices rise while quantities stay the same, nominal GDP rises. Real GDP adjusts for inflation by holding prices constant at a base‑year level, isolating changes in actual production volume. For instance, US nominal GDP grew 5.8 percent in 2024, but real GDP grew only 2.5 percent; the remaining 3.3 percentage points reflected price increases rather than additional output. Real GDP is the figure cited in growth rate headlines because it reflects genuine economic expansion.
GDP per capita divides total GDP by population. It serves as a rough proxy for average living standards, but because income and wealth are distributed unevenly, per capita figures can be misleading. A country with high GDP per capita may still have widespread poverty if a small fraction of the population captures most of the gains. The distinction between mean and median income is central to understanding this limitation.
Potential GDP estimates the level of output an economy could sustain at full employment without generating accelerating inflation. It is not directly observable; economists estimate it using statistical filters and models of the labor market, capital stock, and productivity. The output gap, the difference between actual GDP and potential GDP, indicates whether an economy is operating above capacity (positive gap, inflationary pressure) or below capacity (negative gap, slack). Central banks monitor the output gap closely when setting interest rates, as it signals whether monetary stimulus or restraint is appropriate. The OECD Economic Outlook provides regular estimates of potential output for member countries.
For further details on national income accounting, see the article on measuring national income. A broader introduction to the field is available in the introduction to macroeconomics, while a detailed treatment of related data appears in the guide to mastering economic indicators.
GDP Growth Data and Charts
Real GDP growth rates for the United States, United Kingdom, Canada, and the Eurozone over the past two decades illustrate both common global cycles and country‑specific divergences. The synchronized collapse during the 2008–2009 financial crisis, the sharp but uneven COVID‑19 recession of 2020, and the inflationary boom of 2021–2022 are all visible.
Source: IMF World Economic Outlook Database, April 2026; OECD.Stat; national statistical agencies.
The table below compares the world’s ten largest economies by nominal GDP with their corresponding GDP per capita adjusted for purchasing power parity (PPP). PPP adjustments account for differences in price levels across countries, offering a more meaningful comparison of actual living standards than nominal exchange‑rate conversions.
| Rank | Country | Nominal GDP (USD Trillions, 2026 est.) | GDP per Capita, PPP (USD, 2026 est.) |
|---|---|---|---|
| 1 | United States | 29.4 | 86,200 |
| 2 | China | 20.1 | 25,800 |
| 3 | Germany | 5.0 | 69,100 |
| 4 | Japan | 4.4 | 52,300 |
| 5 | India | 4.3 | 10,200 |
| 6 | United Kingdom | 3.9 | 59,400 |
| 7 | France | 3.3 | 60,800 |
| 8 | Italy | 2.5 | 55,100 |
| 9 | Canada | 2.4 | 63,900 |
| 10 | Brazil | 2.3 | 20,100 |

|
|||
Source: IMF World Economic Outlook Database, April 2026; World Bank World Development Indicators.
The contrast between China’s position as the second‑largest economy and its relatively modest GDP per capita highlights the importance of population scaling. Smaller advanced economies like Canada and Germany achieve high per capita output despite lower aggregate GDP. These distinctions underscore why no single GDP metric suffices for assessing economic health.
Limitations of GDP
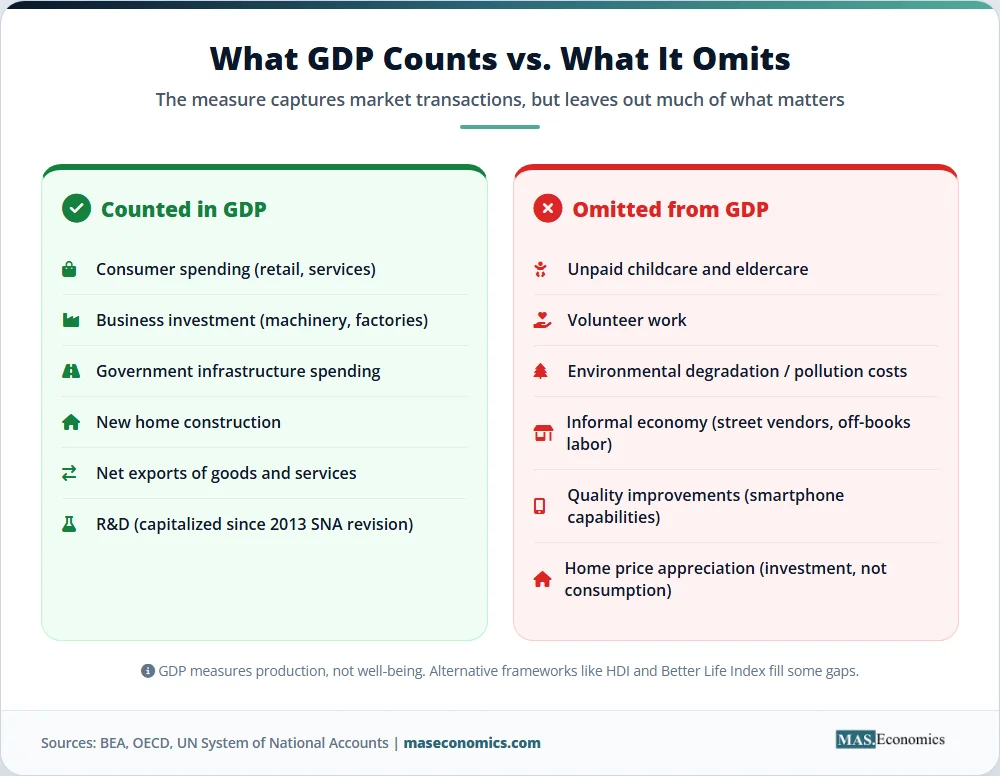
Despite its ubiquity, GDP suffers from well‑documented shortcomings that limit its utility as a welfare measure. These limitations fall into several categories.
Non‑market activity. GDP excludes all production that does not occur through formal market transactions. Unpaid household labor, including childcare, eldercare, cooking, and cleaning, represents a substantial share of total economic activity, particularly in countries with limited public services or extended family structures. OECD estimates suggest that including the value of unpaid household work would increase measured GDP by 20–60 percent in advanced economies. Volunteer work and open‑source software development are similarly invisible in the accounts.
Income and wealth inequality. Aggregate GDP growth reveals nothing about the distribution of gains. In the United States, World Inequality Database figures show the top 10 percent of households captured approximately 45 percent of national income in 2023, while the bottom 50 percent received just 14 percent. An economy can register robust GDP growth while median wages stagnate and poverty persists. This disconnect between aggregate and household‑level outcomes has fueled skepticism toward GDP as a policy target.
Environmental degradation and resource depletion. GDP treats the consumption of natural capital as income rather than depreciation. Deforestation, overfishing, and carbon emissions all increase measured GDP in the short run while diminishing future productive capacity. The BP Deepwater Horizon oil spill of 2010 boosted US GDP through cleanup expenditures and legal fees, despite causing extensive environmental damage. Alternative frameworks such as the United Nations’ System of Environmental‑Economic Accounting (SEEA) attempt to integrate natural capital into national accounts, but these remain supplementary rather than central measures.
The informal economy. In many developing countries, a large fraction of economic activity occurs outside formal regulatory and tax frameworks. The informal sector includes street vendors, unregistered small businesses, and off‑the‑books labor. The International Labour Organization estimates that over 60 percent of the world’s employed population works in the informal economy, with the share exceeding 85 percent in sub‑Saharan Africa. These activities are either estimated imprecisely or omitted entirely from official GDP figures, understating true output and complicating cross‑country comparisons.
Quality improvements and new goods. GDP deflators struggle to account for quality changes and the introduction of entirely new products. A smartphone today offers capabilities, including camera, GPS, internet access, and computing power, that would have cost millions of dollars in 1980 equipment. Standard price indices capture only a fraction of this consumer surplus, meaning real GDP growth likely understates improvements in living standards over long periods. The Bureau of Economic Analysis continues to research methods for better capturing quality change.
Leisure and well‑being. GDP measures production, not happiness or life satisfaction. Countries with high GDP per capita tend to report higher average well‑being, but the correlation is far from perfect. Once basic material needs are met, additional income yields diminishing returns in self‑reported happiness, a finding known as the Easterlin Paradox. The World Happiness Report 2025 shows that factors beyond income, including social support and freedom, strongly influence life evaluations. Activities that enhance well‑being, such as time with family, exercise, and sleep, are not counted in GDP unless they involve market transactions.
These limitations have prompted the development of alternative indicators. The United Nations’ Human Development Index (HDI) combines GDP per capita with measures of health and education. The OECD’s Better Life Index incorporates housing, work‑life balance, and environmental quality. Bhutan’s Gross National Happiness index and New Zealand’s Living Standards Framework represent more radical departures from GDP‑centric policymaking. None of these alternatives has displaced GDP as the primary metric, but they increasingly inform policy discussions alongside traditional growth figures.
Policy Implications
Central banks and finance ministries rely heavily on GDP data when calibrating fiscal and monetary policy. The Federal Reserve’s Summary of Economic Projections includes GDP growth forecasts alongside inflation and unemployment projections. Fiscal authorities use GDP growth to estimate tax revenues and assess debt sustainability. Yet the limitations described above mean policy based solely on GDP growth can be misguided.
Efforts to improve measurement are ongoing. The IMF’s Data Standards Initiatives promote higher‑quality and more timely national accounts data. The European Union’s Beyond GDP initiative funds research into well‑being metrics and environmental accounting. The US Bureau of Economic Analysis now publishes experimental statistics on the distribution of personal income growth and on the value of household production. These developments reflect a growing recognition that GDP growth, while essential, is an incomplete barometer of economic health.
MASEconomics Explains
Four economic concepts behind GDP growth
Conclusion
Global GDP growth of 3.3 percent in 2026 represents a continuation of moderate expansion, but the aggregate figure obscures vast differences across countries, sectors, and households. GDP growth explained requires an understanding not only of what the measure captures, market production valued at prevailing prices, but also of what it omits. Non‑market work, environmental costs, informal activity, and distributional outcomes all lie outside the standard accounting framework. Distinguishing nominal from real GDP, aggregate from per capita measures, and actual from potential output adds further nuance essential for informed interpretation. While GDP remains indispensable for macroeconomic management, its limitations demand that policymakers, investors, and citizens supplement it with a broader dashboard of well‑being and sustainability metrics.
Did you find this article helpful? Share it with someone who loves economics. And remember, at MASEconomics, we make complex ideas simple.