Welcome to MASEconomics, the ultimate guide to economic indicators. Let’s explore the secrets behind crucial measures that drive economies worldwide.
In this comprehensive article, we’ll delve deep into a diverse range of economic indicators, from the leading indicators that offer foresight into future trends to lagging indicators that provide historical context and coincident indicators that give us real‑time snapshots of the present economic landscape. We’ll transcend national boundaries to explore the global interconnectedness of economies, uncovering how these indicators influence international trade, investments, and policy decisions.
Whether you’re an analyst, investor, policymaker, or just a curious mind seeking to comprehend the forces shaping our world, with this knowledge, you’ll be able to make informed investment decisions and confidently adapt to economic changes.
Discover how economic indicators shape government policies and drive economic growth. Explore advanced models that predict trends with remarkable accuracy.
Let’s explore economic indicators and predict future trends.
What are Economic Indicators?
Before we dive into the details of economic indicators, it’s essential to establish a solid foundation. Economic indicators serve as the pulse of an economy, offering insights into its health and trajectory. They’re like signposts on a journey, guiding us through the twists and turns of economic fluctuations.
At their core, economic indicators are statistical measures or data sets that provide crucial information about an economy’s condition. These indicators range from employment rates to inflation figures, production levels, and consumer spending patterns. Each indicator tells a unique story, shedding light on different aspects of economic activity.
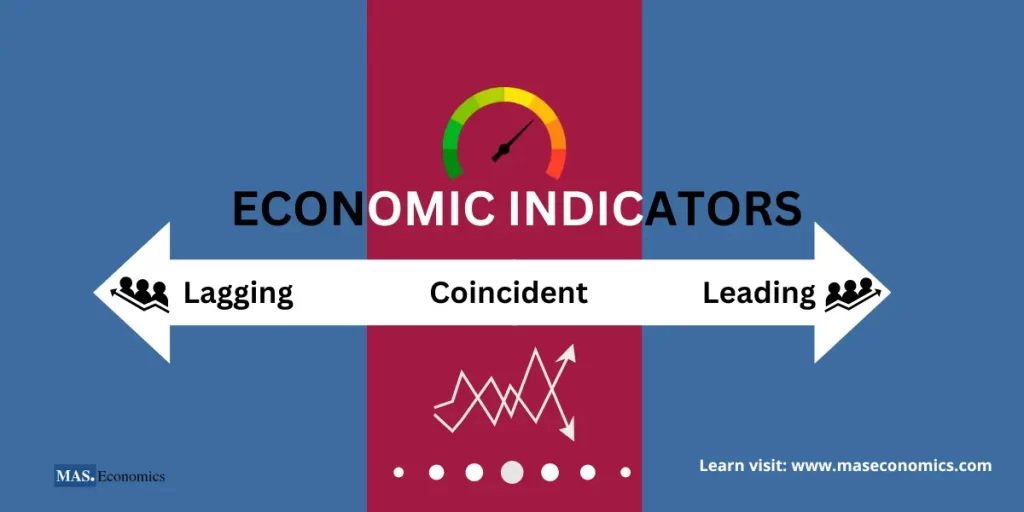
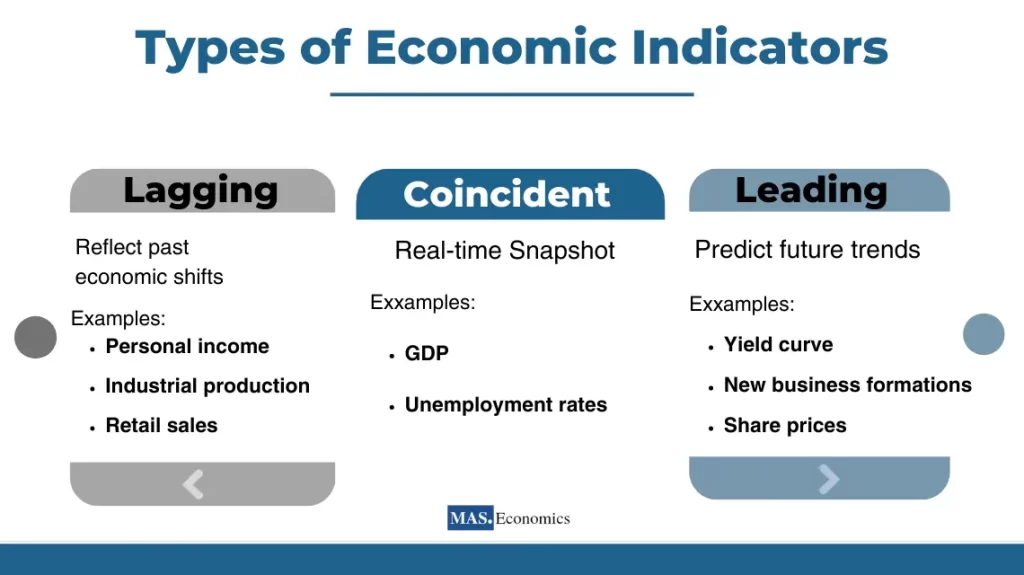
To comprehend economic indicators fully, we classify them into three primary categories: leading indicators, lagging indicators, and coincident indicators. These classifications serve as a compass, helping us navigate the vast sea of economic data.
Leading Indicators
Consider driving in unfamiliar terrain. Leading indicators are the road signs that give you an early hint about what’s coming ahead. These indicators change before the economy does, making them invaluable tools for predicting future economic trends. We’ll explore the yield curve, new business formations, and share prices, each providing insights into where the economy might be headed.
Lagging Indicators
Lagging indicators are like looking in the rear‑view mirror; they provide a historical perspective of where the economy has been. These indicators change after the economy changes, which means they’re not predictors but rather confirmations of trends. We’ll delve into GDP, unemployment, and interest rates, unpacking their significance in assessing past economic performance.
Coincident Indicators
Coincident indicators are the dashboard of your economic vehicle. They move in sync with the economy, offering real‑time snapshots of its current state. These indicators help us understand the present economic conditions and form the basis for analyzing the business cycle. We’ll explore industrial production, retail sales, and personal income, uncovering their role in vividly depicting the economy’s ongoing status.
By understanding these categories, you’ll be equipped with the tools needed to decipher the predictive nature of each indicator. As we progress, you’ll learn how these indicators work harmoniously to present a comprehensive view of economic health.
In the next section, we’ll explore the fundamental metrics economists and policymakers use to evaluate an economy’s well‑being and make informed decisions.
Leading Indicators
To predict future economic trends, it is crucial to focus on leading indicators. By understanding these indicators, investors and businesses can gain valuable insights into the economic landscape and make informed decisions. This section emphasizes the importance of leading indicators and the benefits they provide for forecasting and planning.
The Yield Curve
The Yield Curve is a crucial leading indicator that measures the difference between short‑term and long‑term interest rates. Investors must pay attention to an inverted yield curve, indicating an impending recession, where long‑term rates fall below short‑term rates.
Publisher: Central banks, financial institutions (e.g., U.S. Department of the Treasury, Federal Reserve)
By analyzing the yield curve’s shape and shifts, investors can gain valuable insights into market expectations of economic performance. For the latest US yield curve data, see our United States economic profile.
New Business Formations
New Business Formations are another significant leading indicator that suggests entrepreneurial optimism and potential economic growth. An increase in new businesses indicates that entrepreneurs are confident about the economy’s trajectory, making them more likely to invest in new ventures.
Publisher: Government agencies, business registries (e.g., U.S. Census Bureau, Companies House UK)
Monitoring business formation data is essential in providing early signs of economic expansion. New business formations are measured by tracking the number of newly registered businesses, startups, and entrepreneurial ventures.
Share Prices
Share Prices, often represented by stock market indices, are a crucial component of leading indicators. These prices reflect investor expectations about future company performance and overall economic conditions. Changes in stock prices offer valuable insights into market sentiment and potential economic shifts.
Rising stock prices indicate a positive investor outlook, while sharp declines may suggest economic concerns. Share prices are tracked using stock market indices such as the S&P 500, Dow Jones Industrial Average, or regional indices (PSX).
Publisher: Stock exchanges, financial data providers (e.g., New York Stock Exchange, Nasdaq, Bloomberg)
Lagging Indicators
This part focuses on lagging indicators; unlike their leading counterparts, lagging indicators provide insights into changes that have already taken place in the economy. While they may not serve as predictors, they are indispensable for gauging past economic performance and discerning future trends. The lag time associated with lagging indicators can vary, contingent on specific contextual factors and the prevailing economic conditions of a given country.
Gross Domestic Product (GDP)
One of the most crucial lagging indicators is GDP. It reflects overall economic activity after it has occurred and often assesses the phases of the business cycle. Economists and policymakers gain insights into the economy’s health and recent performance by analyzing GDP growth or contraction.
Publisher: National statistical agencies (e.g., U.S. Bureau of Economic Analysis, Eurostat, China’s National Bureau of Statistics, Pakistan MOF)
GDP is calculated through three distinct approaches that each focus on different components of economic activity.
The production approach involves summing up the value‑added at each stage of production across all industries, including compensation to employees, gross operating surplus, and taxes less subsidies on production and imports.
GDP = Compensation to Employees + Gross Operating Surplus + Taxes on Production and Imports – Subsidies on Production and Imports
The income approach computes GDP by summing up all the incomes earned in the economy, such as wages, interest, rent, and profits.
GDP = Wages + Interest + Rent + Profits
Lastly, the expenditure approach calculates GDP by summing up all expenditures made in the economy, including consumption, investment, government spending, and net exports (exports minus imports).
GDP = Consumption + Investment + Government Spending + (Exports – Imports)
Real vs. Nominal GDP
GDP can be measured in two ways: nominal GDP and real GDP. Understanding the difference between these two measures is crucial for accurately reflecting economic activity.
- Nominal GDP: Nominal GDP is calculated using current prices. It reflects the value of goods and services produced without accounting for changes in price levels. As a result, nominal GDP can be influenced by inflation.
- Real GDP: Real GDP is adjusted for changes in price levels, providing a more accurate representation of actual changes in economic output. It allows us to compare economic performance across different time periods without the influence of inflation.
Real GDP = (Nominal GDP / GDP Deflator) × 100
To explore real GDP data for major economies, visit our Economic Data Dashboard.
Consumer Price Index (CPI)
The CPI is a useful indicator that tracks changes in the prices of everyday household goods and services. Tracking these changes helps us understand inflation trends and how they affect our purchasing power. As prices go up or down, the CPI reflects these changes and helps economists and policymakers assess the state of the economy.
Publisher: National statistical agencies (e.g., U.S. Bureau of Labor Statistics, Statistics Canada, Office for National Statistics UK, Pakistan PBS)
To measure CPI, we follow these steps:
- Selection of the Basket: A representative basket of goods and services that households frequently purchase must be determined. This basket includes essential items such as food, housing, transportation, and healthcare.
- Collection of Price Data: Consistent collection of price data for each item in the basket is necessary. The prices should be collected from a variety of retail outlets to ensure representation across different regions.
- Calculation of the Index: The CPI index must be calculated using the formula:
CPI = (Cost of Basket in Current Period / Cost of Basket in Base Period) × 100
The base period CPI is set to 100.
Consumer Price Index (CPI) serves as a critical gauge of how inflation affects the buying power of consumers. When CPI increases, it indicates inflation and causes the value of money to decrease. This can have an impact on interest rates, wage negotiations, and decisions regarding monetary policy. For current CPI figures, see our profiles for the United States, Germany, and Japan.
Producer Price Index (PPI)
The CPI measures consumer prices, while the PPI monitors price changes of goods and services at the producer level. It is a useful tool to identify inflationary pressures in the production process. When input costs change for producers, it can impact consumer prices in the future.
Publisher: National statistical agencies, central banks (e.g., U.S. Bureau of Labor Statistics, European Central Bank, Pakistan PBS)
The process of measuring PPI is not difficult, and it is similar to CPI. However, it focuses on prices at the producer level. The steps involved in measuring PPI include:
To measure PPI, select a basket of goods, collect price data, and calculate the index using a formula similar to CPI.
PPI helps identify early signs of inflation in the production process. It can impact producers’ pricing strategies, supply chain dynamics, and input costs.
Unemployment Rate
The unemployment rate is another significant lagging indicator, reflecting economic conditions that led to job losses or the availability of employment opportunities. A high unemployment rate might indicate economic contraction, while a low rate suggests economic health. Tracking changes in unemployment rates is vital for understanding labor market dynamics.
Publisher: National labor departments, statistical agencies (e.g., U.S. Bureau of Labor Statistics, International Labour Organization, Pakistan PBS)
To determine the unemployment rate, here are the steps you need to take:
- Determine the Labor Force: This group is made up of people who are employed and those who are unemployed but seeking work. It does not include individuals who are not actively looking for work, such as full‑time students or retired people.
- Identify the Unemployed: People who do not have a job, are available for employment, and are actively seeking work are classified as unemployed.
- Calculate the Unemployment Rate: To calculate the unemployment rate, use this formula:
(Number of Unemployed / Labor Force) × 100
It carries significant implications for both an economy and its citizens, such as:
- High unemployment rates suggest that there’s a significant underutilization of human capital, which can lead to a lower potential for economic growth.
- Unemployment can be the root cause of several social issues, including income inequality, poverty, and a decrease in overall well‑being.
- Governments rely on the unemployment rate to formulate policies that aim to improve job creation, education, and training programs. Therefore, it’s vital to recognize the gravity of this matter and take the necessary steps to address it.
Compare unemployment rates across economies on our dashboard – see South Africa’s high rate or Thailand’s low rate for extreme examples.
Interest Rates
Interest rates, especially those set by central banks, are lagging indicators responding to economic condition changes and influencing economic growth. Central banks raise interest rates to cool down spending when the economy grows too quickly. Conversely, during periods of economic downturn, central banks may lower rates to stimulate borrowing and spending.
Publisher: Central banks (e.g., Federal Reserve, European Central Bank, Bank of Japan, Central Bank of Pakistan)
Economic activity is significantly impacted by interest rates in the following ways:
- Borrowing and Investment: Lower interest rates play a crucial role in promoting economic growth by encouraging borrowing for consumption and investment.
- Monetary Policy: Central banks effectively control the money supply and influence economic conditions through the use of interest rates as a tool.
- Savings and Consumption: Higher interest rates have the power to incentivize saving and reduce consumption, which in turn affects overall demand in the economy.
Different types of interest rates serve specific purposes, such as:
- The nominal interest rate, which represents the stated rate without accounting for inflation. It’s the rate mentioned in loan agreements or investment contracts.
- The real interest rate, on the other hand, adjusts the nominal rate for inflation, providing a more accurate measure of the actual purchasing power gained or lost through borrowing or investing.
- Lastly, the effective interest rate considers compounding, which is the process of earning interest on both the initial amount and any previously earned interest.
This historical perspective is crucial for understanding how the economy has responded to different events and policy measures. See current policy rates for the US, UK, and Pakistan.
Coincident Indicators
This section focuses on coincident indicators that move simultaneously with the economy, providing real‑time insights into its current state. Coincident indicators help understand current economic conditions and form a basis for analyzing the business cycle.
Industrial Production
Industrial production is a crucial coincident indicator, providing insights into current manufacturing and production levels and reflecting the economic activity status. An increase in industrial production usually signifies economic growth, while a decline could signal a contraction. This indicator is closely tied to the overall health of the manufacturing sector.
Publisher: National statistical agencies, central banks (e.g., U.S. Federal Reserve, Eurostat)
Industrial production is measured by the total output of industrial sectors, usually represented as an index relative to a base year.
Industrial Production Index = (Total Output in Current Period / Total Output in Base Period) × 100
Retail Sales
Retail sales, measuring consumer spending on goods and services, are also vital coincident indicators. They offer real‑time information about consumer behavior and economic performance. When consumers are confident and spending, it indicates a healthy economy. Conversely, a decline in retail sales might suggest economic challenges.
Publisher: National statistical agencies, commerce departments (e.g., U.S. Census Bureau, Office for National Statistics, UK)
Retail sales are measured by the total value of sales from retail establishments, often represented as an index relative to a base year.
Retail Sales Index = (Total Value of Sales in Current Period / Total Value of Sales in Base Period) × 100
Acyclical Indicators
In this section, we will focus on acyclical indicators that defy the typical leading, lagging, or coincident indicator patterns. These indicators do not always align with the business cycle and require careful analysis.
Wage Share
One such acyclical indicator is wage share. Despite its lack of a clear connection with the employment rate or the general direction of the economy, its complexity and relevance in economic analysis cannot be overlooked.
Publisher: Labor departments, statistical agencies, research institutions (varies by country)
The Wage Share represents the percentage of overall income produced by an economy that is given to workers as payment in the form of wages and salaries. This is a significant gauge that helps reveal the distribution of income between labor and capital.
To measure the Wage Share, you must follow these steps precisely:
- Add up all wages and salaries earned by individuals within the economy to get the Total Labor Income.
- Calculate the total income generated in the economy, including wages, salaries, profits, rents, and other forms of income, to get the Total Income.
- Calculate the Wage Share by dividing the Total Labor Income by the Total Income and multiplying by 100 to get the Wage Share as a percentage. Don’t skip any steps or make any mistakes.
Wage Share = (Total Labor Income / Total Income) × 100
The dimensions of the Wage Share must be analyzed to fully understand the income distribution between labor and capital. These dimensions include:
- Long‑Term Trends: Tracking changes in the Wage Share over an extended period is crucial in revealing shifts in income distribution.
- Sectoral Variations: The Wage Share can vary across sectors, indicating wage level disparities and differences in labor contribution.
- Influence of Technology: Changes in technology can significantly impact labor’s share, as automation and digitalization alter the value of labor input. It is essential to consider all these dimensions to gain a comprehensive understanding of Wage Share.
Global Economic Indicators
In this section, we expand our lens to cover global economic indicators. Given the interdependent nature of economies worldwide, gaining knowledge about global economic indicators is essential to comprehend this interconnectedness.
Global Purchasing Managers’ Index (PMI)
The Global PMI sheds light on the performance of manufacturing and service sectors globally. This composite indicator provides insights into economic activity levels across different countries.
The PMI is calculated through surveys of purchasing managers in various countries. A reading above 50 indicates expansion, while a reading below 50 suggests contraction.
Rising PMI values indicate economic growth, increased business activity, and potential job creation.
The Global PMI is often compiled by private research firms and financial institutions to provide insights into the global manufacturing and services sectors. (e.g., IHS Markit, J.P. Morgan Global Manufacturing PMI, ISM Manufacturing PMI)
US Employment and Consumer Spending
The economic health of the United States, the world’s largest economy, significantly influences global trends. Tracking indicators like US employment data and consumer spending provides insights into the strength of consumer demand and overall economic performance.
Increasing employment and consumer spending signify a robust economy and potential positive spillover effects on global demand. For the latest US data, see our United States profile.
Exports and Trade Data
Global trade indicators, such as exports and import data, reveal the extent of international economic integration. These indicators reflect the flow of goods and services between countries and offer insights into the health of international trade relationships.
Exports data are reported by national statistical agencies, showcasing the value of goods and services exported to other countries.
Employment figures are published by the US Bureau of Labor Statistics, including the number of nonfarm payrolls and the unemployment rate. Consumer spending is reported through retail sales data.
Rising exports indicate increased global demand, trade relationships, and economic cooperation among nations. Explore trade balances for major economies like China and Germany.
Euro‑Area Inflation
As a collection of European countries sharing the euro currency, the Euro‑Area’s economic indicators have far‑reaching implications. The Euro‑Area inflation rate is a critical indicator to monitor, as it affects the purchasing power of millions of consumers and impacts the economic policies of the European Central Bank.
Inflation rates are published by Eurostat, the statistical office of the European Union, and are calculated through the Consumer Price Index (CPI).
Controlled inflation fosters economic stability, while hyperinflation or deflation can disrupt economic equilibrium. See current Euro‑Area inflation on our Germany, France, and Italy pages.
Deciphering Economic Indicators
In this section, we will explore how to interpret economic indicators in various market conditions. Depending on the phase of the economic cycle – expansion, recession, or recovery different strategies are required to effectively understand and utilize economic data.
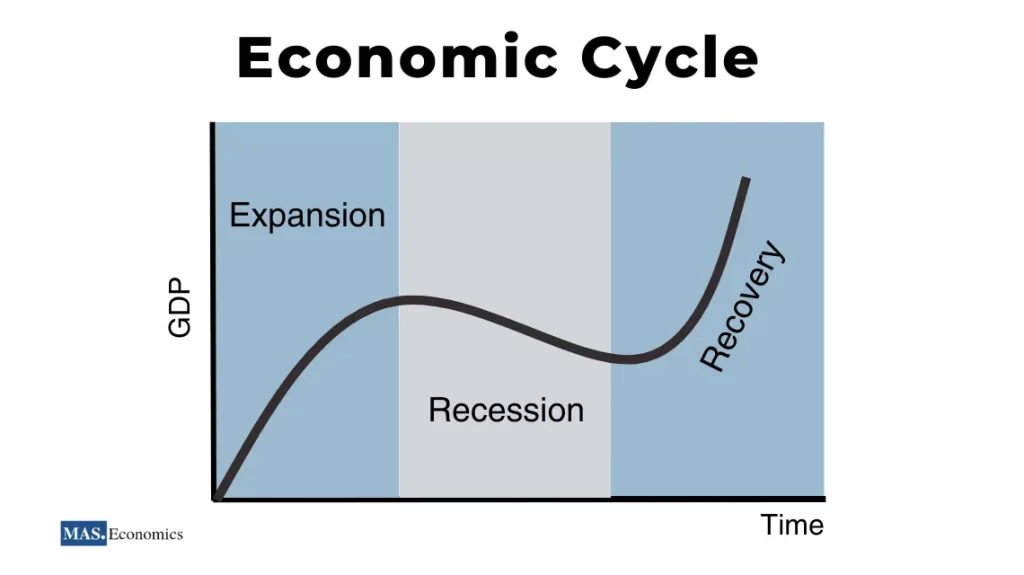
Economic Expansion
During periods of economic growth, leading indicators become valuable tools for anticipating future trends. The economy’s upward momentum is supported by indicators like rising share prices, increased business formations, and an upward‑sloping yield curve. These indicators collectively paint a picture of optimism and economic vibrancy. The United States during 2021–2022 exhibited many of these characteristics.
Economic Recession
As the economy contracts, the focus shifts to lagging indicators that provide historical perspectives on economic shifts. Rising unemployment rates, declining GDP, and falling consumer spending indicate the challenges faced during a recession. Understanding these indicators helps identify the depth and duration of economic downturns. The 2008 global financial crisis and the more recent 2020 pandemic‑induced recession are stark examples.
Economic Recovery
Coincident indicators take center stage in the recovery phase. They offer real‑time insights into ongoing economic improvements. Rising industrial production, increasing retail sales, and reduced unemployment rates signal the economy’s transition toward stability and growth. Countries like Vietnam and India have shown strong recovery patterns in recent years.
Grasping how to interpret economic indicators depending on market conditions is crucial for well‑timed investment decisions and adaptability to evolving economic landscapes.
Influence on Policy Creation
In this section, we will discuss the significant role played by economic indicators in policy‑making. Decision‑makers rely heavily on economic data when devising fiscal and monetary policies.
Central Bank’s Role
Central banks use indicators like interest rates and inflation to steer economic growth and stability. Adjusting interest rates can influence borrowing costs, impacting spending and investment levels. Inflation indicators help central banks maintain price stability and prevent runaway price increases. The Federal Reserve, Bank of England, and Bank of Japan all publish their policy rates and inflation targets.
Government Policies
Indicators such as GDP, unemployment, and consumer expenditure guide government policies. High unemployment rates may trigger stimulus packages to boost job creation, while solid GDP growth can lead to cautious tightening to prevent overheating.
Balance and Strategy
Policymakers must balance short‑term stimulus and long‑term stability. Economic indicators act as crucial signposts, guiding the creation of strategies that sustain economic health while addressing immediate challenges.
Understanding the connection between economic indicators and policy creation is vital for assessing the efficacy of governmental interventions and their impact on the economy.
The final section explores advanced economic indicators and predictive models used in contemporary economic analysis.
Predictive Models
In this last section, we will explore advanced economic indicators and predictive models that are used in modern economic analysis. These advanced tools allow economists to analyze complex economic patterns and make more precise predictions.
Econometric Models
These complex statistical models incorporate multiple economic variables to simulate possible scenarios. Econometric models help economists understand the relationships between factors and forecast potential outcomes.
Artificial Intelligence Algorithms
Rapid advancements in artificial intelligence have enabled economists to harness machine learning algorithms. These algorithms analyze vast data to identify patterns and correlations that might elude traditional methods. AI models contribute to more nuanced economic predictions.
Leading‑Edge Indicators
Beyond traditional indicators, economists now have access to unconventional, leading‑edge indicators. These range from satellite images tracking shipping activity to sentiment analysis of social media posts. The diversity of indicators enhances the accuracy of economic predictions.
Real‑Time Data
Technological advancements allow for the collection and analysis of real‑time data. Economists can gauge economic conditions more accurately and respond swiftly to changing trends. Our Economic Data Dashboard provides weekly updates on 30+ indicators for 28 countries, bringing real‑time insights to your fingertips.
By comprehending these advanced indicators and predictive models, you gain insights into economists’ state‑of‑the‑art tools to analyze intricate economic trends and make more accurate predictions.
Wrapping Up
Your understanding of economic analysis has deepened, and your appreciation for the pivotal role of indicators has grown stronger. These measures serve as guiding lights in the ever‑shifting economic landscape, illuminating pathways that lead to informed decisions and well‑crafted policies.
From understanding the predictive nature of leading indicators to deciphering the insights offered by lagging and coincident indicators, you now possess a versatile toolkit to navigate the complexities of economic analysis.
We expanded our view to the global stage, understanding the dance of economies through international indicators. Your ability to interpret these empowers you to make timely investment decisions and adapt to changing tides. We’ve discovered the relationship between indicators and policy‑making, revealing how they steer economies toward prosperity.
Remember, these indicators hold the key to deciphering economic trends.
Explore live economic data: Visit our Economic Data Dashboard to see current indicators for 28 countries, updated weekly. Compare GDP growth, inflation rates, unemployment, and more across economies like the United States, China, Germany, Japan, and India.
FAQs:
What are economic indicators, and why are they important?
Economic indicators are data points that provide insights into an economy’s current state, past performance, and potential future trends. They help investors, analysts, and policymakers understand economic health, predict trends, and make informed decisions.
What is the difference between leading, lagging, and coincident indicators?
- Leading indicators change before the economy shifts, helping predict future trends (e.g., stock market indices).
- Lagging indicators follow economic changes and confirm long-term trends (e.g., GDP).
- Coincident indicators move simultaneously with the economy, reflecting the current state (e.g., retail sales).
How can investors use leading indicators?
Investors use leading indicators like the yield curve, new business formations, and share prices to anticipate future economic conditions. These insights can guide investment decisions and risk management strategies.
What role does the yield curve play as a leading indicator?
The yield curve shows the relationship between short-term and long-term interest rates. An inverted yield curve, where short-term rates are higher than long-term rates, often signals an upcoming recession.
Why is GDP considered a lagging indicator?
GDP is considered a lagging indicator because it measures the total economic output after economic activities have already occurred. It provides insights into past economic performance and the business cycle’s phase.
What is the Consumer Price Index (CPI), and why does it matter?
The CPI measures changes in the prices of a basket of consumer goods and services, reflecting inflation levels. It is crucial for assessing the purchasing power of consumers and guiding central banks in adjusting monetary policy.
How do interest rates influence economic activity?
Interest rates impact borrowing costs for consumers and businesses. Lower rates encourage borrowing and investment, stimulating economic growth, while higher rates can slow down spending to control inflation.
What is the role of real-time data in economic analysis?
Real-time data, such as up-to-date retail sales or shipping activity, allows for faster analysis of economic trends, helping analysts and policymakers react swiftly to changes in the economy.
Thanks for reading! If you found this helpful, share it with friends and spread the knowledge.
Happy learning with MASEconomics