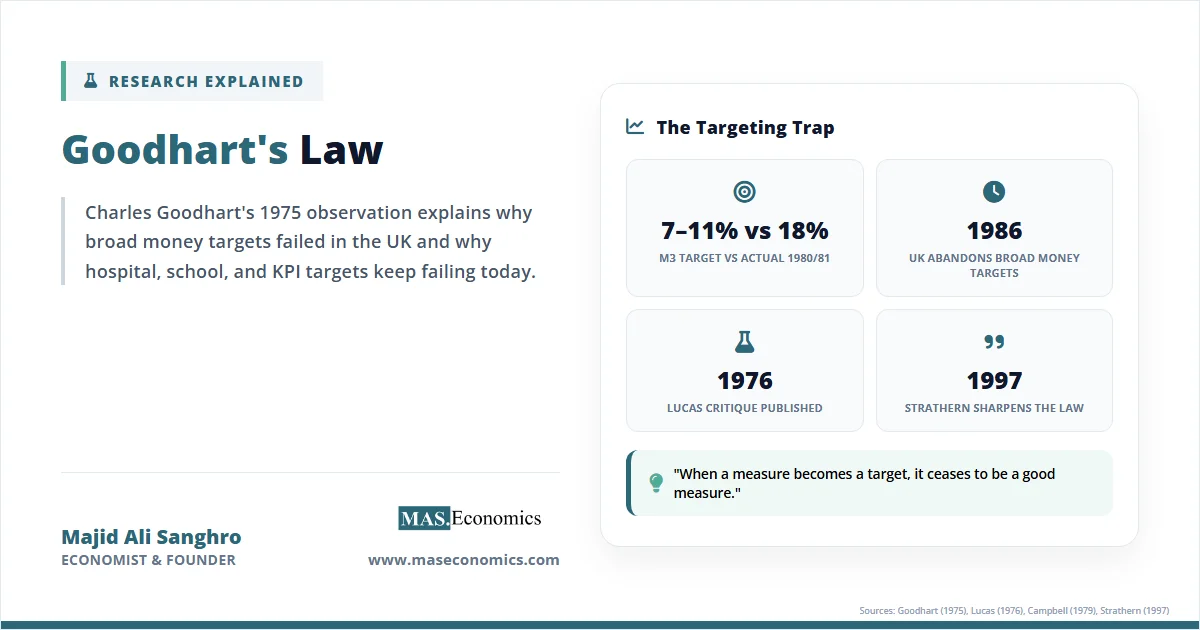
In 1980, the British government set a target range of 7–11% for £M3 broad money growth. The outturn was 18%. Within five years, the relationship between money supply and inflation that had held for decades had collapsed entirely. Goodhart’s Law economics takes its name from the Bank of England adviser who watched this happen in real time and gave a name to a pattern that now appears across every domain where numbers are used to govern behaviour.
Charles Goodhart’s 1975 observation, written for a Reserve Bank of Australia conference, was narrow in scope. He was describing why the Bank of England’s chosen monetary aggregates kept losing their predictive power. The generalised version, sharpened by anthropologist Marilyn Strathern in 1997, is the one most people quote: when a measure becomes a target, it ceases to be a good measure.
The implication runs deep. Every modern policy regime, from inflation targeting to hospital wait-time benchmarks to school test scores, depends on indicators that were stable before they were used for control. The question is not whether Goodhart’s Law applies, but how quickly it bites and how much damage it does before policymakers notice.
How Statistical Regularities Collapse
Goodhart’s original 1975 formulation was technical: any observed statistical regularity will tend to collapse once pressure is placed upon it for control purposes. The intuition is simple. A correlation between two variables is the joint product of the underlying behaviour of agents and the institutional environment. When policymakers begin steering one of those variables, agents respond. The behaviour shifts. The correlation that motivated the policy disappears.
The UK case made this concrete. Through the 1960s and early 1970s, sterling M3 (the volume of bank deposits in the economy) tracked nominal GDP and inflation closely. Monetarists argued the relationship was structural. Friedman’s quantity theory implied that controlling M3 would control prices. The Bank of England formalised broad money targets in 1976 under the Labour government, and the Thatcher administration tightened them after 1979.
What happened next is the textbook case. Banks and corporations responded to the controls by inventing instruments that performed the same function as bank deposits but fell outside the M3 definition. Interest-bearing near-money assets multiplied. Building society deposits, which were not counted in the targeted aggregate, expanded rapidly. Off-balance-sheet credit creation grew. The targeted variable became less and less informative about underlying monetary conditions, while inflation continued to be driven by factors that the M3 number no longer captured.
By 1986, the UK had abandoned broad money targets. The official explanation, given by Chancellor Nigel Lawson, was that financial innovation had made the aggregates unreliable. The earlier explanation, given by Goodhart himself, was that targeting them had caused the innovation.
Goodhart, Lucas, and Campbell Compared
Three closely related ideas circulated in the mid-1970s, each capturing a different facet of the same problem. Distinguishing them matters because they imply different remedies.
Goodhart’s Law is about indicators. It says the predictive power of any economic statistic degrades when the statistic is used for policy control, because agents adjust their behaviour around the indicator rather than the underlying economic reality.
The Lucas Critique, formulated by Robert Lucas in 1976, is about econometric models. It says that the parameters of a behavioural equation estimated under one policy regime will not remain stable under a different regime, because agents form expectations about policy and adjust their decision rules accordingly. The Lucas Critique is more general: it applies even when no specific indicator is being targeted. Goodhart’s Law is the special case where the policy involves directly steering a measured variable. Both rest on the same insight that economic relationships are conditional on behaviour, and behaviour is conditional on what authorities are doing.
Campbell’s Law, stated by social psychologist Donald Campbell in 1979, is the social-science cousin. Campbell wrote that the more any quantitative social indicator is used for social decision-making, the more it will be subject to corruption pressures and the more it will distort the social processes it is intended to monitor. Campbell’s framing is broader than Goodhart’s because it covers crude gaming and outright fraud, not just rational adjustment. Campbell predates Goodhart by several years and has an arguably stronger claim to priority. The economics literature kept Goodhart’s name because his version was about money and was widely cited inside central banks.
The three together describe a single phenomenon viewed from different angles: economic relationships are not natural laws but the equilibrium outcome of agents responding to incentives. Change the incentives, and the relationship moves.

Goodhart’s Law in Equations
A simple model captures the mechanism. Let \( y \) be an indicator that policymakers observe, and let it depend on policy effort \( e \) and a structural parameter \( \theta \) that summarises behaviour:
Before targeting begins, \( \theta \) is stable. The historical correlation between \( y \) and a deeper welfare variable \( w \) is well-estimated:
where \( \varepsilon \) is a small error term. Policymakers, observing this correlation, conclude that controlling \( y \) will control \( w \). They set a target \( y^* \) and adjust \( e \) to hit it.
The problem is that \( \theta \) is endogenous to the policy regime. When \( y \) becomes the operational target, agents reorganise their behaviour to optimise around \( y \) rather than around \( w \). Formally, \( \theta \) shifts to \( \theta'(y^*) \), and the relationship becomes:
The new \( \varepsilon’ \) is no longer small. The earlier mapping from \( y \) to \( w \) breaks. The indicator continues to be measurable, and the target may even be hit, but the link to the underlying objective has weakened or disappeared.
Two conditions determine how badly Goodhart’s Law bites. The first is the elasticity of \( \theta \) with respect to \( y^* \). If agents can easily reshape their behaviour to game the indicator, the parameter shifts quickly. The second is the gap between the indicator \( y \) and the welfare variable \( w \). The cruder the proxy, the more room there is for the proxy to move while \( w \) stays put or moves in the opposite direction.
| Concept | Symbol | Definition |
|---|---|---|
| Indicator | \( y \) | Measurable variable used as a proxy for policy success |
| Welfare variable | \( w \) | The underlying objective the indicator is meant to track |
| Policy effort | \( e \) | Resources or rules deployed to influence the indicator |
| Structural parameter | \( \theta \) | Behavioural relationships linking the indicator to welfare |
| Target | \( y^* \) | The level of the indicator policymakers aim to achieve |
| Goodhart shift | \( \theta'(y^*) \) | The new behavioural parameters after targeting begins |
 | ||
Table 1. Goodhart’s Law: Variables in the simple targeting model.
The model also explains why some targets survive. If the indicator is the welfare variable itself, or very close to it, then \( \theta \) is irrelevant. There is no proxy gap to exploit. This is the case for credible inflation targeting under modern central banks. Inflation is what policymakers actually care about, not a proxy for it. Agents cannot game the CPI in any way that improves their position without genuinely lowering price growth.
Conditions That Intensify Goodhart’s Law
Goodhart’s Law is not deterministic. The intensity depends on three conditions, each of which can be observed in advance.
The first is the gap between the proxy and the goal. M3 was a proxy for inflation and nominal demand, not the thing itself. Hospital wait times are a proxy for healthcare quality. Test scores are a proxy for learning. The wider the gap, the more behaviour can shift the proxy without shifting the goal.
The second is the manipulability of the indicator. Some variables can be reshaped easily by frontline agents. A school can teach to the test. A hospital can reclassify patients. A bank can move deposits to off-balance-sheet vehicles. Other variables are harder to manipulate because they are determined by aggregate market forces or reported by independent agencies. The CPI is harder to game than a self-reported customer satisfaction score.
The third is the stakes. When budgets, careers, or political reputations depend on the number, the incentive to optimise the indicator at the expense of the underlying goal grows sharply. Charles Goodhart later observed that high-stakes targets tend to fail faster because the gaming response is rational, well-resourced, and continuous.
The same conditions tell us when targets can survive. A measure that is itself the policy goal, that is determined outside the control of those subject to the policy, and that is set with credible institutional commitment, can remain a useful target for long periods. Inflation targeting in the 1990s and 2000s broadly satisfies these criteria. The persistence of the inflation–policy link does not refute Goodhart’s Law. It identifies the boundary conditions under which targeting works.
One further qualification matters. Goodhart’s Law describes a tendency, not an instant collapse. Indicators degrade gradually as agents learn the new regime, find loopholes, and reorganise. Early in a targeting regime, the relationship may look stable. The breakdown often arrives years later, after policymakers have invested political capital in the framework.
The UK Monetary Targeting Episode
The historical case that gave Goodhart’s Law its name remains the cleanest empirical illustration. The UK adopted formal broad money targets in 1976 under an IMF-supervised stabilisation programme. From 1979 onwards, the Thatcher government’s Medium-Term Financial Strategy made £M3 the centrepiece of disinflation policy.
The targets failed almost immediately. The 1980/81 target range for £M3 was 7–11%; actual growth was 18%. Subsequent targets were missed repeatedly. Treasury ministers explicitly invoked Goodhart’s Law to explain the gap between targeted and realised aggregates. The pre-targeting correlation between £M3 and inflation, which had been stable through the 1960s, broke down sharply after 1980. By 1986, Chancellor Lawson formally suspended broad money targeting.
The mechanism was financial innovation in response to control. UK banks introduced interest-bearing chequing accounts. Building societies, which sat outside the £M3 definition, expanded their deposit base. Banks shifted credit creation into instruments that did not appear in the targeted aggregate. None of this was hidden. Each innovation was a rational response to a regulatory environment that placed a binding constraint on one form of money while leaving substitutes free.
The chart below compares the trajectory of UK broad money growth and CPI inflation through the targeting period and after. The pre-targeting correlation is visible in the 1970s. The breakdown is visible in the early 1980s, when M3 growth surged while inflation fell. After targets were dropped, the two series moved independently for long stretches.
Source: Office for National Statistics; Bank of England historical statistics. UK broad money (£M3 / M4) annual growth and CPI inflation, 1975–1995.
Modern Cases of Goodhart's Law
The monetary case is one application. The same dynamic appears wherever institutions tie consequences to a single number.
NHS hospital wait-time targets in England, introduced under the Blair government in the early 2000s, set a four-hour limit on waits in accident and emergency departments. Trusts that missed the target faced budget penalties and management interventions. The targeted statistic improved sharply. Investigations later found systematic gaming. Patients were held in ambulances outside the door so that the four-hour clock did not start. Some trusts reclassified patients into categories outside the target. A House of Commons Public Accounts Committee inquiry in 2009 documented widespread manipulation. The proxy improved while the underlying experience of patients in many cases did not.
The US No Child Left Behind Act, signed in 2002, made school funding and staffing decisions contingent on student performance on standardised reading and mathematics tests. Test scores rose. Independent assessments, such as the National Assessment of Educational Progress, which schools could not directly prepare students for, showed much smaller gains. Research by Jacob and Levitt documented outright score manipulation in Chicago public schools. More widely, curricula narrowed toward tested subjects. Music, art, and untested sciences lost classroom time. The proxy moved. The deeper goal of educational quality moved less, and in some dimensions moved backwards.
The pandemic policy debate over targeting the reproduction number R0 raised the same issue. Several governments treated R0 as a control variable, setting policy to keep it below one. Epidemiologists pointed out that R0 was a noisy, lagged estimate constructed from case data that itself depended on testing intensity. Targeting an estimated R0 risked the same proxy collapse that monetary targeting had produced fifty years earlier. By 2022, most public health agencies had moved to dashboards of multiple indicators rather than a single targeted number.
Corporate KPI culture supplies a steady stream of further examples. Wells Fargo's account-opening targets, Volkswagen's emissions test scores, and university publication counts that incentivise salami-sliced research and replication failures all share the same structure. A measurable proxy is tied to consequences; agents optimise the proxy; the link between the proxy and the underlying goal weakens or breaks.

How Goodhart Shapes Policy Today
The lessons from Goodhart's Law have reshaped modern macroeconomic frameworks. Central banks moved away from monetary aggregates as targets in the late 1980s and 1990s, replacing them with inflation as the target itself. The shift was not arbitrary. It reflected the view that an indicator close to the welfare goal would survive targeting better than a proxy. Most of the disinflation of the 1990s and 2000s took place under inflation-targeting regimes that have now been studied extensively in the literature on inflation-targeting frameworks.
The success of inflation targeting also depends on the institutional architecture surrounding it. Central bank independence reduces the political incentive to game the indicator through statistical reclassification or short-term distortions. Transparent communication and the publication of forecasts make manipulation more visible. The combination of a near-welfare-relevant target with credible institutions has, so far, kept the inflation–policy relationship more stable than the money–policy relationship ever was.
Even within inflation targeting, however, Goodhart effects appear at the margins. The choice of price index matters. Headline CPI, core CPI, the PCE deflator, and trimmed-mean measures all give different readings. When central banks emphasise one measure, agents and forecasters concentrate attention on it, and second-order distortions can develop. The 2021–2023 inflation episode revealed that headline CPI was being dragged by energy and food shocks while core measures and asset prices were telling different stories. The lesson the Federal Reserve and the European Central Bank drew was that no single indicator should bear the entire weight of policy attention.
The Taylor Rule literature illustrates the same caution. The rule, developed by John Taylor in 1993, links the policy interest rate to inflation and the output gap. It is a useful benchmark, and a deeper treatment is available in our explainer on the Taylor Rule and its application. In practice, central banks treat such rules as guidelines rather than mechanical commitments. The reason is Goodhart's Law: a mechanical commitment to a Taylor-rule formula would invite the same gaming and instability that broad money targets attracted. Rules informed by judgment, refreshed against new data, and supplemented by multiple indicators have proven more durable than rules followed mechanically.
The broader implication for empirical economics is methodological. Statistical relationships estimated under one regime cannot be assumed to hold under another. This is the foundation of modern rational expectations macroeconomics and explains why structural models, which attempt to estimate deep parameters that are invariant to policy, are preferred in serious policy analysis. Reduced-form correlations are useful for description but dangerous for control. Goodhart's Law is the warning sign attached to every reduced-form regression that gets converted into a policy lever.
Public-sector management has absorbed similar lessons more slowly. The shift from single-target performance management toward dashboards and balanced scorecards in healthcare, education, and policing reflects the recognition that any single number can be gamed. The UK National Audit Office, the US Government Accountability Office, and OECD performance reviews now routinely warn against over-reliance on single indicators. Whether this awareness is translated into policy design is uneven. New targeting regimes continue to be introduced, and new Goodhart breakdowns continue to be discovered.
For empirical work, the practical advice is constant model refreshment. A relationship that held in past data tells you what was true under past behaviour. It does not tell you what will be true once that relationship is used for steering. Causal-identification methods, sensitivity to regime change, and robustness across multiple proxies are now standard requirements in serious applied economics. The intellectual debt to Goodhart, Lucas, and Campbell is direct.
MASEconomics Explains
Four economic concepts behind Goodhart's Law
Conclusion
Goodhart's Law economics describes a structural feature of any control system in which the controllers and the controlled both respond to incentives. When an indicator is selected for targeting, the agents whose behaviour generates that indicator reorganise around the new constraint. The pre-targeting correlation that motivated the policy weakens or disappears. The cleaner the proxy, the more elastic the agents, and the higher the stakes, the faster the breakdown.
The UK monetary targeting experience between 1976 and 1986 remains the foundational case. £M3 went from a stable predictor of inflation to an unreliable aggregate within a few years of being adopted as a target. Subsequent applications across healthcare, education, public health, and corporate management have repeated the pattern. Modern inflation targeting works because the target is close to the welfare variable and the institutional architecture limits manipulation. The boundary conditions, not the law itself, have changed.
The methodological consequence is permanent. Economic relationships are not natural laws. They are conditional regularities that depend on the behaviour and expectations of agents. Policy regimes that ignore this fact destroy the very indicators on which they rely. Policy regimes that build it in, through multiple indicators, regular model revision, and proximity between target and goal, have a chance of lasting.
Did you find this article helpful? Share it with someone who loves economics. And remember, at MASEconomics, we make complex ideas simple.