The hardest part of regression is not running one; software has made that a single line. The hard part is saying, in words, what the numbers mean, and it is here that published work, student papers, and policy briefs go wrong most often. To interpret regression coefficients correctly is to answer four questions about every number in the table: what are its units, what transformation is the variable wearing, what is being held constant, and what kind of claim, association or cause, the design entitles it to. Each question has a mechanical answer that takes a minute to check, each is skipped routinely, and the resulting errors range from mildly embarrassing, a percentage read as a percentage point, to genuinely consequential, a log coefficient reported at a hundred times its size or an interaction’s main effect quoted as if it were the average effect. This article is the decoder ring: the small set of rules that turns printout into English without loss.
Units First: The Level-Level Baseline
In the plain specification with untransformed variables, the reading is the one taught alongside simple linear regression: the coefficient is the change in the outcome, in the outcome’s units, associated with a one-unit change in the regressor, in the regressor’s units, with everything else in the model held fixed. Every word earns its place. A coefficient of 0.08 on years of schooling in an hourly-wage equation means 8 cents more wage per additional year, not 8 percent, not 8 dollars; whether that is large is a question about the units and the context, not the digits. The “held fixed” clause is the contribution of multiple regression, and it means held fixed among the variables in the model, nothing more: the phrase promises statistical adjustment for the listed controls, not the sealed-laboratory ceteris paribus of theory, and reading it as the latter is how omitted-variable stories get smuggled into causal-sounding sentences.
The Log Ladder, Dummies, and Interactions
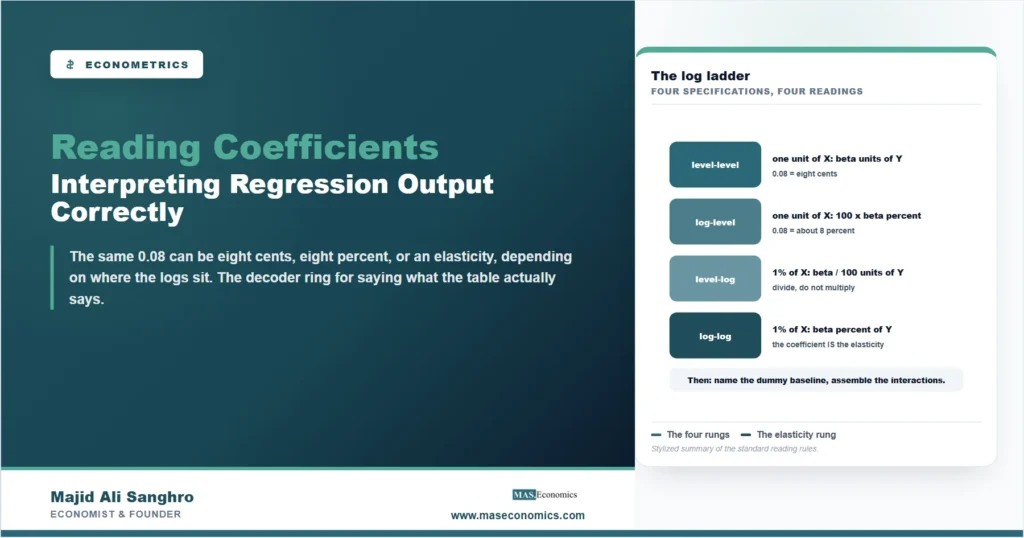
Logarithms change the reading, and the ladder in the figure is worth memorizing outright, because economics lives on it. With the outcome in logs, a coefficient of 0.08 on schooling means roughly 8 percent higher wages per year of schooling, the multiplication by 100 being the step most often botched in both directions; with both sides in logs, the coefficient is an elasticity, percent for percent, which is why demand, production, and trade equations are so often estimated log-log. The percent readings are small-change approximations, drifting for coefficients far from zero, and the exact conversion exists for the cases that need it.
Dummy variables read differently again: a coefficient on a zero-one indicator is the gap between that category and the omitted reference category, everything else held fixed, so the number is meaningless until the reference is named. A coefficient of 0.15 on an urban dummy in a log-wage equation says urban workers earn about 15 percent more than the rural workers who form the baseline, and recoding the baseline changes every dummy coefficient while changing nothing about the world. Interactions are the step beyond, and the step where the most confident misreadings occur: once a model includes the product of schooling and gender, there is no longer any single “effect of schooling” in the table. The schooling coefficient now belongs to the reference gender alone, the interaction coefficient is the difference in slopes, and the effect for the other group must be assembled by addition. Quoting the main effect as the average effect, the standard error of the assembled sum ignored, is among the most frequent errors in applied work, and it is entirely mechanical to avoid.
What the Reading Rules Cannot Deliver
Two boundaries keep the decoder honest. The first is functional: in the nonlinear models of binary choice, the raw coefficients of logit and probit are not marginal effects at all, only their signs read directly, and honest reporting converts them to probability changes at meaningful values; similar care applies whenever the model bends. Related, a single equation reports one slope for everyone, an average; where the relationship differs across the distribution, at the bottom of the wage scale versus the top, the single number conceals it, which is the case for the distribution-wide view of quantile regression. The second boundary is the one this site returns to wherever regression is discussed: every reading above is an association, a difference in conditional averages, and the upgrade to “X causes Y to rise by beta” is purchased by research design, not by phrasing. When the regressor is correlated with omitted influences, the coefficient absorbs their work and no interpretation rule repairs it; that is the endogeneity problem, and the repair toolkit is the subject of our article on instrumental variables. A disciplined reader keeps the two vocabularies apart: “associated with” is earned by the arithmetic, “caused by” is earned by the design, and the table itself never says which one a study has.
MASEconomics Explains
3 economic concepts behind interpreting coefficients
These concepts are explored in depth across our educational articles library.
Explore the MASEconomics BlogConclusion
To interpret regression coefficients is to run a short checklist that the printout will never run for you. Establish the units and the transformations, because the same 0.08 is eight cents, eight percent, or an elasticity depending on where the logs sit. Name the reference category before reading any dummy, and refuse to read any variable that appears in an interaction until the pieces are assembled for the group in question. Say “held constant” with its honest, model-bound meaning, and keep the association vocabulary until the research design, not the sentence structure, earns the causal one.
None of this is advanced; that is the point. The gap between competent and careless empirical work is less often the estimator than the English attached to it, and the errors that propagate furthest, the percentage-point confusions, the misread interactions, the causal phrasing on correlational designs, are all preventable by a minute of unit accounting. The regression answers exactly the question it was asked, in exactly the units it was given. Reading output correctly is the discipline of repeating that answer without improving it.
Frequently Asked Questions
What does a regression coefficient mean in simple terms?
In a plain linear model, it is the change in the outcome, in the outcome’s units, associated with a one-unit change in that regressor, with the other variables in the model held fixed. The units of both variables and any transformations they wear decide the reading, which is why unit accounting comes before any judgment about size.
How do you interpret coefficients when variables are in logs?
By the log ladder. Outcome in logs: multiply the coefficient by 100 and read percent change per unit of the regressor. Regressor in logs: divide by 100 and read outcome units per one percent change. Both in logs: the coefficient is the elasticity, percent for percent. The percent readings are approximations that work best for coefficients near zero.
How do you interpret a dummy variable coefficient?
As the gap between that category and the omitted reference category, holding the other regressors fixed; in a log-outcome model the gap reads in percent. The number has no meaning until the reference group is identified, and changing the reference changes every dummy coefficient without changing any substantive conclusion.
Why can’t the main effect be read directly when there is an interaction?
Because the interaction splits the slope by group: the main effect belongs only to the reference category, the interaction coefficient is the difference in slopes, and other groups’ effects must be assembled by adding the pieces, with a standard error computed for the sum. Quoting the main effect as everyone’s effect is a mechanical misreading of the model.
Does a well-interpreted coefficient establish causality?
No. All the reading rules deliver is the correct statement of an association: a difference in conditional averages. Whether that association measures a causal effect depends on the research design, on whether the regressor is clean of omitted influences and reverse causation, and no amount of careful phrasing substitutes for identification.
Thanks for reading! The regression answers exactly what it was asked, in exactly the units it was given; the craft is repeating that answer without improving it. Happy learning with MASEconomics