A government that runs a deficit has to explain what the borrowing bought. Roads, defense, pensions, tax cuts: each has a constituency that can say what it got. There is one line in the budget that buys nothing at all, and it is now the fastest growing item in the United States federal accounts. Interest on the federal debt reached $1,247.0 billion at an annual rate in the second quarter of 2026, an all-time high, and it is not spending in any ordinary sense. It is the rent on decisions already taken.
That number is not a secret. It sits in a public database that anyone can open, and it has been reported widely. Repeating it is not the point. The point is what almost nobody says next: interest is a payment, and every payment has a recipient. Somebody receives $1.2 trillion a year. Working out who, and what changed about who, tells you more about the American economy in 2026 than the total ever will.
Two Thirds of the Gap Is the Cost of Filling Earlier Gaps
Start with the arithmetic that turns a large number into a recognizable situation.
Federal debt stood at $39.07 trillion in the first quarter of 2026, which is 122.59 percent of gross domestic product. That implies an economy of roughly $31.9 trillion. An interest bill of $1,247.0 billion is therefore close to 3.9 percent of everything the country produces in a year.
Set that beside the deficit. In fiscal 2025 the federal deficit was 5.77 percent of GDP. The two figures come from different vintages, and they should not be presented as a single snapshot, but even allowing for that the proportion is hard to miss. Roughly two thirds of the amount the United States borrows each year is now the cost of servicing what it borrowed before.
This is the fact worth sitting with. A deficit is usually discussed as a choice about what to fund. A rising share of this one is not a choice at all. The coupons were fixed years ago, the maturity dates were set years ago, and the Treasury pays them the way a household pays a mortgage it signed in a different decade. The guide to what government balances actually mean sets out why the deficit is a flow that must be financed. What the current figures add is that the flow is increasingly financing itself.
The Debt Did Not Double. The Price of Carrying It Did.
The instinct on seeing an interest bill more than double is to assume the borrowing more than doubled. It did not. The mechanism is slower and less dramatic, and it explains why the increase kept arriving long after the interest rate rises that caused it.

In the second quarter of 2021 the federal government paid $560.6 billion a year in interest. Five years later it pays $1,247.0 billion. The increase alone, $686.4 billion, is larger than the entire interest bill of 2021. And note the 2019 figure of $586.4 billion, which is higher than 2021: the bill briefly fell while rates were near zero even though the debt was growing.
What happened in between is refinancing. Government debt matures constantly, and maturing debt has to be replaced. A ten-year note issued in 2015 at a low coupon was repaid in 2025 and replaced at whatever the market demanded in 2025. Each of those swaps is small. Repeated across trillions of dollars, year after year, they reprice the whole stock from the interest rates of the last decade to the interest rates of this one.
This is why the bill kept climbing after the tightening cycle ended. The average interest rate on the debt is a slow moving average of past auctions, and it is still catching up. Even if market rates stopped moving tomorrow, the average would keep rising for years as old low coupon paper continues to mature. That lag is also why the composition of the debt matters as much as its size, a point the work on how maturity prices interest rate risk develops in detail.
Every Dollar of Interest Is Income to Somebody
Here is where the public conversation usually stops and where the interesting part begins.
Interest on government debt is not consumed by the act of paying it. It is a transfer. Taxpayers, present and future, hand money to whoever holds the bonds. The national accounts record an expense; the same transaction is somebody else’s income. Ask who that somebody is and the story changes character, because it stops being a question about arithmetic and becomes a question about distribution.
For most of the last fifteen years, a large and growing share of that income went to the central bank. Through the asset purchase programs described in the article on quantitative easing, the Federal Reserve accumulated enormous holdings of Treasury securities. Interest paid on those holdings largely returned to the Treasury as remittances. The government was, to a meaningful extent, paying interest to itself.
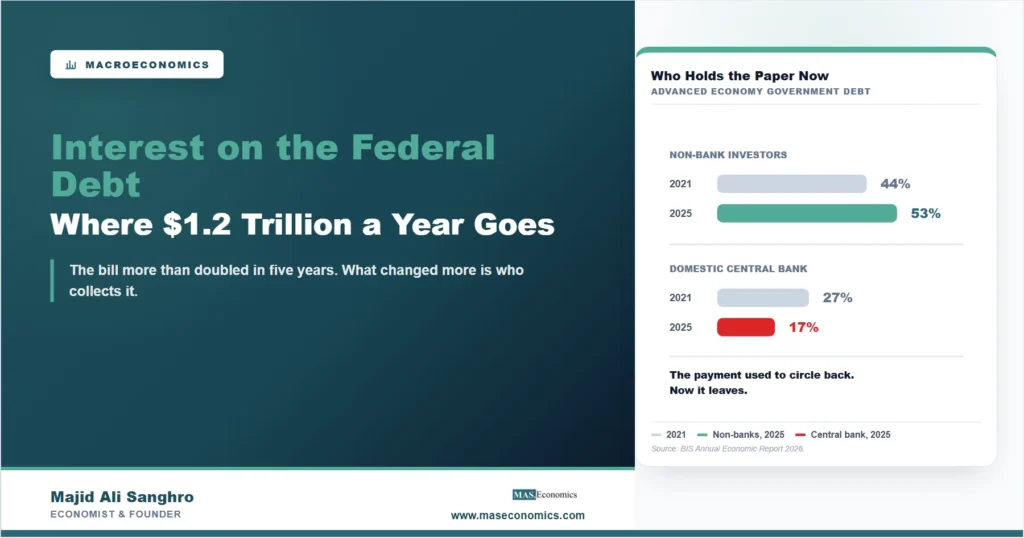
That arrangement has been unwinding, and the scale of the shift is documented in the Bank for International Settlements Annual Economic Report 2026. Across advanced economies, the share of government debt held by domestic central banks fell from 27 percent to 17 percent between 2022 and 2025 as balance sheets shrank. The foreign official sector slipped from 15 percent to 13 percent. Banks stayed close to 20 percent. The gap was filled by non-bank financial institutions, whose share rose from 44 percent in 2021 to 53 percent by the end of 2025.
| Holder | 2021 share | Latest share | What it means for the interest payment |
|---|---|---|---|
| Non-bank financial institutions | 44% | 53% | Pension funds, insurers, money market funds and leveraged hedge funds. The payment leaves the public sector entirely |
| Domestic central bank | 27% | 17% | Interest largely returns to the treasury as remittances, so the net cost is small |
| Banks | about 20% | about 20% | Supports bank earnings and, indirectly, lending capacity |
| Foreign official sector | 15% | 13% | The payment leaves the country |
|
|
|||
Read the table as a distribution question and it says something the headline total cannot. A rising interest bill paid to a central bank that remits the proceeds is close to an accounting entry. The same bill paid to private investors, foreign holders and leveraged funds is a genuine transfer out of the budget and into private portfolios. The composition changed at exactly the moment the total was doubling.
Who ultimately receives it is a harder question than any single dataset answers, because pension funds and insurers hold bonds on behalf of households. But bond ownership is concentrated, in every economy that measures it, among older and wealthier households and among foreign investors. A transfer financed by general taxation and received by bondholders does not distribute evenly. That is not an argument for or against borrowing. It is a fact about who is on each side of the line, and it belongs in any honest description of what the number does.
Why Raising Rates Now Does Less Than It Used To
The distribution point is not only about fairness. It changes how monetary policy works, and this is the part with the most direct consequence for anyone holding a mortgage or a business loan.
The textbook account of a rate rise is straightforward. Borrowing costs rise, spending falls, inflation eases. When the government owes 122 percent of GDP, that account becomes incomplete, because the same rate rise sets three different forces running at once. The BIS separates them, and they do not point the same way.
| Channel | What happens | Effect on demand | Effect on inflation |
|---|---|---|---|
| Fiscal risk repricing | Higher payments worsen the fiscal outlook, so investors demand a larger risk premium | Tightens further | Weakens the disinflation, because the currency and expectations can move |
| Valuation | Bond prices fall, holders take losses, lenders’ capacity to lend shrinks | Tightens further | Reinforces the disinflation |
| Interest income | Higher payments become income for domestic bondholders, who spend some of it | Offsets the tightening | Weakens the disinflation |
|
|
|||
The third channel is the one that gets missed, and it is the direct consequence of the transfer described above. Paying $1.2 trillion to bondholders puts $1.2 trillion of income into the economy. Some of it is saved and some is spent, and the part that is spent works against the very tightening that produced it.
Evidence from eleven euro area economies, reported in the same BIS chapter, compares what a rate rise does at a debt ratio of 120 percent of GDP against 60 percent. At the higher ratio the disinflationary response is weaker. The output cost is larger. And in both cases the primary fiscal balance deteriorates after a rate rise rather than adjusting to absorb the higher debt service, which is what the interest income channel looks like in the data.
There is a further result that is genuinely counterintuitive. The strength of monetary policy depends on the maturity of the debt, and not in a straight line. Where maturities are long, bond prices move a great deal and the income transfer is deferred, so policy bites hardest. Where maturities are middling, the income channel offsets more of the effect and policy is weaker. Where maturities are shortest, the effect intensifies again, because constant refinancing exposes the government to rapid repricing. The relationship is U-shaped, which means there is no simple rule of thumb for a debt manager to follow.
Put the pieces together and the practical implication for an American household is uncomfortable. A central bank facing a large public debt may need to hold rates higher for longer to achieve the same disinflation it once achieved quickly. The cost of that patience is paid in mortgage rates, car loans and small business credit. The gap between a policy rate of 3.63 percent and a ten-year Treasury yield of 4.69 percent, with the curve steepening rather than flattening, is the market’s own statement that easing at the short end is not passing through to the rates that matter for long-term borrowing. The article on what the yield curve tells us covers why that spread is read so closely.
The Reason This Matters Outside the United States
An American budget line looks like an American problem. It is not, and the mechanism by which it travels is worth stating plainly, because it reaches people who never buy a Treasury bond in their lives.
The ten-year Treasury yield is the reference price for long-term borrowing almost everywhere. Corporate bonds are priced against it, emerging market sovereign spreads are quoted over it, and the long-term interest rate in a great many countries moves with it. When American fiscal supply pushes that yield up, the increase is exported. A mortgage in Europe, a corporate loan in Asia and a government bond in a middle-income country all reprice, without a single decision being taken in those places. This is the ordinary channel, and it operates continuously.
The extraordinary channel is the one the BIS spends a chapter on, and it is newer. Because non-banks now hold the majority of advanced economy government debt, the market that sets the world’s benchmark rate has become more dependent on leverage and short-term funding. Around 70 percent of bilateral dollar repurchase agreements with hedge funds are transacted at zero haircut, which means borrowing against effectively the full market value of the collateral. Outstanding foreign exchange swaps, forwards and currency swaps reached about $130 trillion at the end of 2025, up from roughly $50 trillion in 2009, and about three quarters of them mature within a year. That is a very large amount of funding that has to be rolled over continuously.
The BIS puts a number on what this combination does to tail risk. The probability of a stress event in the US Treasury market on the scale of the Great Financial Crisis, within any three-month window, is about 3.8 percent when public debt to GDP is high, against 0.3 percent when it is low. Ten times higher. A large NBFI share moves it the same way.
The 2022 episode in the United Kingdom showed what that looks like in practice, and it has since been quantified. Forced selling by pension-related investors produced peak price discounts of around 7 percent in the gilt market, and roughly half of the price fall after the fiscal announcement was fire sales rather than any revision to the fiscal outlook itself. The fundamentals moved the market once. The plumbing moved it again, by about as much.
If that happens in the market for US Treasuries, it is not an American event. It is the reference asset for the global financial system, and the dollar, trading at a broad index of 119.70 at the end of July 2026, is the currency most of the world’s cross-border debt is denominated in. This is the honest reason a reader in Frankfurt, Toronto or Singapore should care about a line in the American budget.
What Would Actually Bend the Line
Three things can reduce a debt ratio: growth faster than the interest rate, a primary surplus, or inflation that erodes the real value of fixed payments. Each is worth a moment, because the first has quietly stopped working.
For most of the period after 2008, nominal growth exceeded the average interest rate on government debt. When that holds, a country can run modest primary deficits forever and still see the debt ratio fall, because the denominator grows faster than the numerator. It made borrowing look close to free, and a good deal of policy was built on the assumption that it would last.
It has reversed. The BIS reports that the gap between bond yields and nominal growth, deeply negative for years, has turned positive in many countries. Governments can no longer rely on growth to stabilize the ratio. They now have to run primary surpluses, or at least much smaller deficits, to hold the line. The analysis of what makes debt sustainable sets out that condition formally, and the discussion of whether the largest economies can keep borrowing applies it to the countries where the sums are largest.
The scale of adjustment implied is large. One estimate cited by the BIS finds that US public debt could rise to around 250 percent of GDP, and that stabilizing it at such a level would require a permanent fiscal adjustment of at least 10 percent of GDP. That is not a forecast of what will happen. It is a statement of what the arithmetic demands under a particular set of assumptions, and its usefulness is in showing how far the required adjustment now sits from anything on the political agenda.
Inflation deserves care here. It does erode the real value of fixed coupons, which is why the distinction between real and nominal magnitudes matters so much in fiscal analysis. But the relief is one-off and it is smaller when debt is short-dated, because short debt reprices quickly at the higher rates that inflation brings. With headline consumer prices running at 3.73 percent and core PCE at 3.29 percent, the United States is not in a position to inflate the problem away without the rates on new issuance rising to meet it.
There is one finding in this literature that is more encouraging than the rest, and it is about behavior rather than arithmetic. Across four decades, most advanced economies expanded fiscal policy in downturns and failed to consolidate in the recoveries, so buffers were spent and never rebuilt. Cyclically adjusted primary deficits in advanced economies averaged 1.1 percent of GDP between 2000 and 2019 and 1.9 percent from 2022 onward. But some countries did not follow the pattern. Chile, Denmark and Sweden consolidated in good times and adjusted symmetrically. The BIS is careful about why, and the reason is not what most commentary assumes: the difference is associated with stronger institutional frameworks and lower initial debt, rather than with the mere existence of fiscal rules. Rules are common. Enforcement is not.
MASEconomics Explains
4 economic concepts behind the federal interest bill
These concepts are explored in depth across our educational articles library.
Conclusion
Interest on the federal debt passing $1.2 trillion a year is a fact that can be looked up. What it means takes a little longer to state. Roughly two thirds of the annual borrowing gap is now the cost of earlier borrowing, the bill more than doubled in five years while the debt stock did not, and the increase came mainly from refinancing old cheap debt at current prices rather than from new spending.
The part that deserves more attention than it gets is the receiving end. As the Federal Reserve’s holdings shrank, the share of advanced economy government debt held by non-bank investors rose from 44 to 53 percent, so a payment that once largely circled back to the treasury increasingly leaves it. That shift does two things at once. It turns an accounting entry into a real transfer, and it weakens the central bank’s own tool, because interest paid to domestic bondholders supports the spending that higher rates were meant to restrain.
None of this makes a fiscal crisis imminent, and it should not be read that way. It makes the situation less flexible, which is a different and more durable problem. Fiscal space now depends on the willingness of leveraged, short-funded intermediaries to keep absorbing issuance, and it can narrow before any measure of solvency says it should. That is the condition to watch, in the United States and in every economy that prices its debt off the Treasury curve.
Frequently Asked Questions
How much interest does the US federal government pay each year?
Federal interest payments reached $1,247.0 billion at a seasonally adjusted annual rate in the second quarter of 2026, an all-time high. That compares with $560.6 billion in the second quarter of 2021 and $894.1 billion in 2023.
Why did the interest bill keep rising after the Federal Reserve stopped raising rates?
Because of rollover. Maturing debt issued years ago at low coupons is replaced at current market rates. The average rate on the whole stock is a slow moving average of past auctions, so it continues to climb for years after market rates settle.
Who receives the interest the government pays?
Whoever holds the bonds. Across advanced economies non-bank financial institutions, including pension funds, insurers and hedge funds, held 53 percent of government debt at the end of 2025, up from 44 percent in 2021. Central bank holdings fell from 27 to 17 percent over 2022 to 2025.
Does high public debt make interest rate rises less effective?
Evidence from euro area economies suggests it does. At a debt ratio of 120 percent of GDP the disinflationary response to tightening is weaker than at 60 percent, because higher payments transfer income to bondholders and support spending, partly offsetting the intended restraint.
Why does the US interest bill matter to people outside the United States?
The ten-year Treasury yield is the benchmark for long-term borrowing worldwide. When American fiscal supply pushes it higher, mortgages, corporate loans and sovereign spreads reprice in other countries automatically. The Treasury market is also the reference asset for the global financial system, so disruption there does not stay local.
Thanks for reading! The total tells you what the government pays; the ownership table tells you what the payment does, and those are two different articles. Happy learning with MASEconomics