Of all the distinctions in economics, the one that does the most work for the least effort is real vs nominal. Master it once, and a surprising number of economic debates resolve themselves. A worker who got a 4 percent raise during a year when prices rose 7 percent did not become richer. A country whose GDP grew 10 percent during 12 percent inflation did not actually produce more. A savings account paying 3 percent during 5 percent inflation is losing the depositor’s purchasing power, even though the balance is growing.
The nominal value is what you see. The real value is what it buys. The gap between them is inflation, and the failure to strip out that gap explains a large share of the confusion in economic news, political debate, and household financial planning. The same arithmetic applies to wages, GDP, and interest rates, and the habit of asking for the real value is the first step in reading any economic number correctly.
What “Real” Actually Means
A nominal value is measured in current prices: the prices that prevailed at the moment the transaction took place. A worker’s nominal wage is the dollar amount on the paycheck. A country’s nominal GDP is the dollar value of output at this year’s prices. A bond’s nominal interest rate is the headline rate quoted on the bond.
A real value is measured in constant prices, holding the price level fixed at some reference point. Real values are nominal values divided by a price index and then expressed relative to a base year. The most common price indexes are the Consumer Price Index (CPI), which tracks a fixed basket of consumer goods, and the GDP deflator, which tracks all goods and services included in GDP. The choice of index matters, but the underlying logic does not change.
Nominal to Real Conversion
The intuition is simple. If your nominal wage rises by 5 percent but prices rise by 5 percent, your real wage is unchanged. You can buy exactly the same basket of goods you could before. If your nominal wage rises by 5 percent and prices rise by 3 percent, your real wage rises by approximately 2 percent. You can buy a slightly larger basket. If your nominal wage rises by 5 percent and prices rise by 8 percent, your real wage falls by approximately 3 percent. The paycheck grew, but it buys less.
The approximation works at low inflation rates. At higher rates, the exact relationship is multiplicative rather than additive, but for the inflation environments most readers will encounter, subtraction gives a close enough answer to be useful.

Applications of the Real‑Nominal Distinction
The strength of the real-nominal distinction is that the same arithmetic logic applies across very different parts of the economy. Once you can do the conversion in one domain, you can do it in any of them. The three most important applications are real wages, real GDP, and real interest rates.
Real Wages
The wage on a paycheck is a nominal number. To know what it actually buys, the nominal wage must be divided by the price level, usually proxied by the CPI. The result is the real wage: what the paycheck buys at base-year prices.
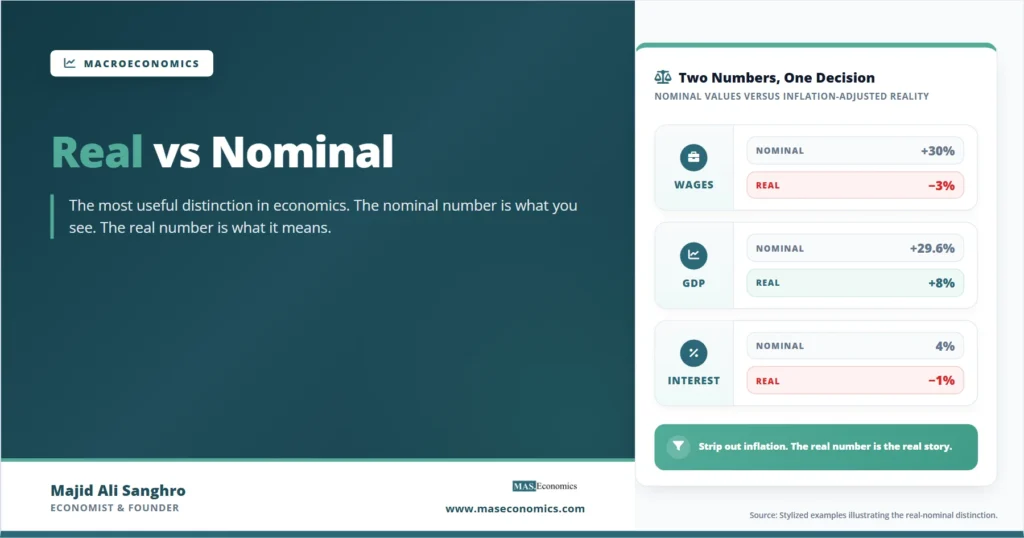
The American experience from the 1970s onward is the textbook case. Median nominal wages in the United States rose more than tenfold between 1970 and the late 2010s. Median real wages, adjusted for CPI, were roughly flat for much of that period, growing modestly only in some intervals. Most of the nominal wage gains were absorbed by rising prices. Workers who looked only at their paychecks could feel as though they were getting ahead. Workers who looked at what those paychecks bought saw a different picture.
The same distinction reappears constantly in current debates. When inflation rose sharply in 2021 and 2022, nominal wages rose at the fastest pace in decades. Real wages, adjusted for CPI, fell for much of that period, because prices were rising even faster. Headlines about strong wage growth and headlines about a cost-of-living crisis were both correct, just measuring different things. The disagreement was about which number actually mattered for living standards.
Caveat on choice of price index. Real wages can look quite different depending on whether they are deflated by headline CPI, core CPI, the PCE price index, or a household-specific measure that weights items by what a particular family actually buys. Reasonable economists can disagree about which index gives the most meaningful real wage figure. The principle is the same. The numbers can differ.
Real GDP
When GDP rises from one year to the next, the increase mixes together two effects: more output produced and higher prices charged. Nominal GDP captures both. Real GDP isolates the output change by holding prices constant at a base year. Most discussions of economic growth, recessions, and living standards refer to real GDP, even when the qualifier is dropped from the conversation.
The arithmetic is the same as for wages, with the GDP deflator replacing CPI as the price index. A country whose nominal GDP grew 30 percent over three years, while its GDP deflator rose 20 percent, saw real GDP grow by approximately 8 percent. The difference between the two figures is large enough that confusing them would produce wildly different conclusions about how the economy performed.
Cross-country comparisons sharpen the point. Argentina and Switzerland might both report nominal GDP growth of 10 percent in a given year. If Argentine inflation is 80 percent, real Argentine GDP is collapsing. If Swiss inflation is 1 percent, real Swiss GDP is genuinely growing. The nominal numbers look comparable. The real numbers tell opposite stories.
Real Interest Rates
The same logic applies to interest rates. The nominal interest rate is the headline rate, the number on the savings account statement, or the mortgage agreement. The real interest rate adjusts for inflation and tells the lender or borrower what is happening to purchasing power.
The Fisher equation captures the relationship:
Fisher Equation (Approximation)
A savings account paying 3 percent during 5 percent inflation has a real interest rate of approximately negative 2 percent. The depositor’s nominal balance grows, but its purchasing power shrinks. A mortgage charging 4 percent during 6 percent inflation has a real rate of negative 2 percent, which is a transfer from lender to borrower in real terms. The 1970s in the United States saw exactly this dynamic on a massive scale: nominal rates rose sharply, but inflation rose faster, leaving real rates deeply negative for years and producing enormous transfers from savers to borrowers, including from bondholders to the federal government.
| Application | Nominal change | Inflation | Real change (approx.) | What it means |
|---|---|---|---|---|
| Worker’s annual raise | +3.0% | 5.0% | -2.0% | Paycheck grew, purchasing power shrank |
| Country’s GDP growth | +7.0% | 5.0% | +2.0% | Modest real expansion of output |
| Savings account return | +4.0% | 5.0% | -1.0% | Saver is losing purchasing power |
| Mortgage interest rate | 6.0% | 5.0% | 1.0% | Borrower’s real cost is modest |
| Government bond yield | 3.5% | 5.0% | -1.5% | Bondholder is losing real wealth |
|
Source: Stylized calculations using a 5 percent inflation assumption.
|
||||
The table shows the same operation applied five times, with five different conclusions about real economic outcomes. The arithmetic is mechanical. The interpretation is what matters.
Money Illusion and Confusion
Economists have a name for the tendency to confuse nominal and real values: money illusion. The term was coined by Irving Fisher, who also formalized the Fisher equation linking nominal rates, real rates, and inflation. Money illusion describes the systematic human tendency to think in nominal rather than real terms, even when nominal numbers are deeply misleading.
The classic experimental finding is that workers strongly resist nominal wage cuts but accept real wage cuts via inflation without complaint. A worker offered a 2 percent nominal cut during zero inflation often refuses, even though the real outcome is identical to accepting a 0 percent nominal raise during 2 percent inflation. The first feels like a loss. The second feels neutral. Both leave the worker with the same real wage.
This is not a quirk of badly informed individuals. The same pattern shows up in survey responses from professional managers, in collective bargaining behavior, and in housing market psychology. Sellers anchor on what they paid in nominal terms and resist nominal losses even when accepting them would leave them with the same real wealth. Borrowers underestimate the real cost of credit card debt because they focus on the minimum payment rather than the compounded real interest charge. Voters punish governments for nominal price increases regardless of whether real wages are keeping pace.
The economist who pays attention to money illusion gains a real advantage: a clearer view of what is actually happening in their own finances, in news stories, and in policy debates. Strip out the price level. Look at what nominal numbers actually buy. The answers are often different from what the headline suggests.
Note. Money illusion is real and persistent, but it is not always irrational. Nominal contracts, debts, and savings are denominated in nominal terms, and rigidities in renegotiating them mean nominal values carry genuine consequences. The mistake is treating the nominal number as the only number that matters, not noticing it exists.
When the Distinction Matters Most
The real-nominal gap matters most when inflation is high or volatile. In stable, low-inflation environments, the two numbers are close enough that confusing them costs little. In high-inflation environments, the gap can be enormous, and the cost of confusion is high.
This is why the distinction became especially important during the 1970s, when persistent inflation in advanced economies forced households, firms, and policymakers to think in real terms, whether they wanted to or not. It receded into the background during the low-inflation decades of the 1990s and 2000s, then returned forcefully in 2021 and 2022 when inflation rose to multi-decade highs across most of the world. The reflexive habit of thinking only in nominal terms, comfortable enough during stable prices, became actively misleading.
The distinction also matters most when comparing across long time horizons. A nominal salary of $20,000 in 1970 sounds modest by today’s standards. In real terms, it was a middle-class income. A house price of $50,000 in 1980 looks like a bargain by current standards. In real terms, adjusted for accumulated inflation, it was roughly equivalent to $190,000 in today’s prices. Long-horizon comparisons of any nominal variable, salaries, prices, GDP, debt, and asset values, almost always require conversion to real terms before they make sense.
Choosing the Right Price Index
The conversion from nominal to real requires dividing by a price index, and the choice of index affects the answer. The main options each measure a different basket.
The Consumer Price Index tracks a fixed basket of consumer goods and services bought by urban households. It is the standard deflator for wages, household income, and cost-of-living comparisons. Variants include core CPI (excluding food and energy) and chained CPI (allowing for substitution between goods as relative prices change).
The GDP deflator covers all goods and services in GDP, including investment, government services, and exports. It is the standard deflator for converting nominal GDP to real GDP.
The Personal Consumption Expenditures (PCE) price index, preferred by the US Federal Reserve, covers consumer spending and allows for substitution. It typically runs slightly below CPI.
The Producer Price Index tracks prices received by domestic producers. It is the standard deflator when analyzing business-side data.
For most purposes, the differences between these indices are small enough that the broad conclusion is the same regardless of choice. But for precise calculations, especially in cost-of-living comparisons, indexation of social benefits, or long-horizon historical comparisons, the choice of index can change the picture in important ways. The principle to remember is to match the index to what is being deflated: consumer wages with CPI, output with the GDP deflator, and business prices with PPI.
A Simple Mental Discipline
The practical takeaway is a habit, not a calculation. Whenever a nominal number appears, particularly in news headlines, political claims, or financial decisions, ask one question: what does this number look like after adjusting for inflation? If inflation is low, the answer will be close to the headline figure. If inflation is high, the answer may be very different. If the comparison spans many years, the real figure is the only one worth taking seriously.
This is the mental discipline that separates economically literate readers from confused ones. It does not require math beyond subtraction in most cases. It requires only the willingness to ask the question.
Explains
Four concepts that build on the real-nominal distinction
Continue exploring inflation, interest, and macroeconomic measurement on the MASEconomics blog.
Explore the MASEconomics BlogConclusion
The real vs nominal distinction is one of the highest-return ideas in economics. Once learned, it applies cleanly to wages, GDP, interest rates, asset prices, government debt, and almost every other quantitative measure in economic life. The arithmetic is straightforward: subtract inflation from the nominal change, or divide by a price index, and the result tells you what the number means in terms of actual purchasing power.
The reason this matters so much in practice is that nominal numbers are what people see. Paychecks are nominal. Bank balances are nominal. Interest rate quotes are nominal. Inflation works in the background, eroding or boosting the real value of each, often without anyone noticing until the gap becomes too large to ignore. Readers who train themselves to ask the real-versus-nominal question automatically gain a clearer view of their own finances, of the news, and of the debates that shape policy. The discipline is small. The payoff is large.
Frequently Asked Questions
What is the difference between real and nominal in economics?
The nominal value of a variable is its current dollar amount, measured at current prices. The real value adjusts for inflation by dividing by a price index, expressing the variable in the constant prices of a base year. The nominal value tells you the dollar amount. The real value tells you what those dollars actually buy.
How do you calculate a real value from a nominal value?
Divide the nominal value by the relevant price index and multiply by 100. The price index equals 100 in the base year, so the result expresses the nominal value in base-year prices. For approximate calculations at low inflation, the real change in a variable is roughly the nominal change minus the inflation rate.
Why does the distinction between real and nominal matter for wages?
A worker who receives a 4 percent nominal pay raise while prices rise 6 percent has experienced a 2 percent real wage cut, even though the nominal paycheck is larger. Living standards depend on what wages buy, not on the headline number, so any meaningful discussion of wage growth requires the real adjustment. The 1970s and the 2021 to 2022 period are textbook cases of rising nominal wages combined with falling real wages.
What is real GDP and why is it more useful than nominal GDP?
Real GDP measures economic output at constant prices, isolating the change in actual production from the change in prices. Nominal GDP mixes both. Comparisons of economic growth, living standards, recessions, and cross-country performance use real GDP because nominal figures can be inflated by price changes without any increase in real output.
What is a real interest rate and how is it different from a nominal interest rate?
The nominal interest rate is the headline rate quoted on a loan or savings account. The real interest rate adjusts for inflation and reflects the actual change in purchasing power. The Fisher equation summarizes the relationship: the real rate is approximately the nominal rate minus the inflation rate. A 4 percent nominal rate during 5 percent inflation gives a real rate of approximately negative 1 percent, meaning the lender is losing purchasing power despite the positive nominal yield.
What is money illusion?
Money illusion is the systematic tendency to think in nominal rather than real terms. Workers resist nominal wage cuts but accept real wage cuts that come through inflation. Homeowners anchor on nominal purchase prices. Borrowers focus on minimum payments rather than real interest costs. The concept was developed by Irving Fisher and remains one of the best-documented patterns in behavioral economics.
Thanks for reading! If you found this helpful, share it with friends and spread the knowledge. Happy learning with MASEconomics