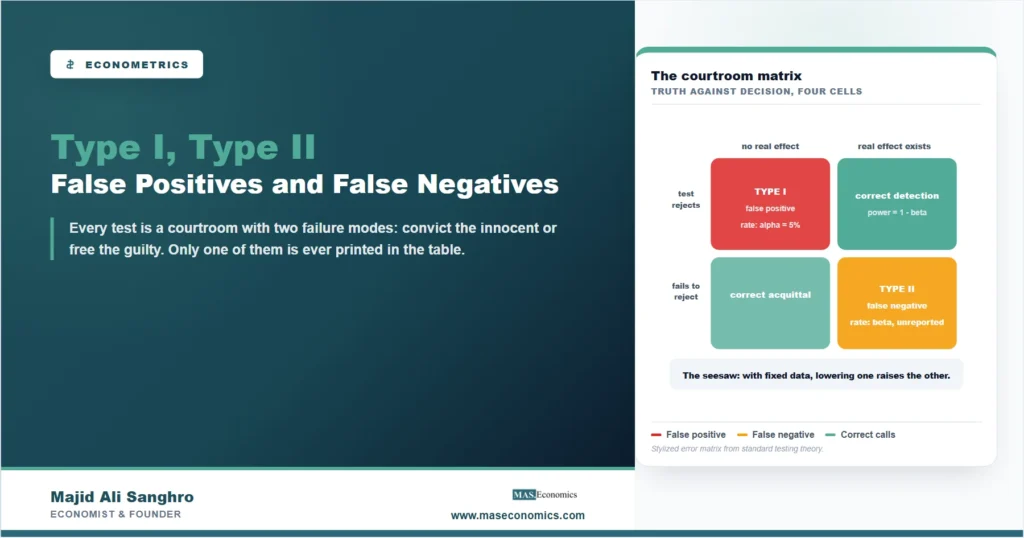
Every hypothesis test is a courtroom, and every courtroom can fail in exactly two ways: convict the innocent or acquit the guilty. Type I and Type II errors are those two failures translated into statistics. A Type I error rejects a null hypothesis that is actually true, announcing an effect that does not exist, the false positive; a Type II error fails to reject a null that is actually false, missing an effect that is really there, the false negative. The two errors trade off against each other, cannot both be driven to zero with fixed evidence, and are treated with a deliberate asymmetry that most users of statistics have absorbed without ever examining: the entire apparatus of 5 percent significance is a decision about which of these mistakes a discipline fears more. Reading empirical results intelligently requires knowing that the decision was made, what it costs, and when the conventional weighting is exactly wrong for the question at hand.
Two Ways to Be Wrong, One Budget of Evidence
The structure comes straight from the testing framework laid out in our guide to hypothesis testing. A test begins with a null hypothesis, usually no effect, and a decision rule: reject the null when the evidence is sufficiently surprising. The rule’s strictness is the significance level, written alpha, and it is precisely the Type I error rate the researcher has chosen to tolerate: testing at 5 percent means accepting that one in twenty true nulls will be wrongly rejected by sheer chance. Set the bar higher and false positives become rarer, but a stricter bar is harder for genuine effects to clear as well, so more of them go undetected, and the Type II error rate, written beta, rises. With a fixed sample, the two error rates sit on a seesaw: every reduction in one is purchased with an increase in the other, and the only way to lower both simultaneously is more or better evidence, larger samples, cleaner designs, less noisy measurement.
The complement of the Type II error rate has its own name and deserves its own attention: power, the probability of detecting an effect of a given size when it truly exists. Power is where the seesaw is managed in practice, because it is the quantity a researcher can plan: before collecting data, one can ask how large a sample is needed for, say, a 90 percent chance of detecting the smallest effect worth caring about. Studies that skip this arithmetic and run underpowered, too little data for the effects plausibly present, are the silent failure mode of empirical work: they mostly miss what they are looking for, and worse, the effects they do catch are systematically exaggerated, because in a noisy small sample only the estimates that happen to land large clear the significance bar. An underpowered literature therefore fills with findings that are simultaneously rare, lucky, and inflated, a mechanism that requires no misconduct at all.
The Asymmetry Nobody Voted On
Convention fixes alpha at 5 percent and lets beta float, which is a value judgment wearing a lab coat: it declares false claims worse than missed discoveries, polices the former at a strict known rate, and leaves the latter unmeasured and frequently enormous. The judgment is defensible where it came from: science accumulates, a false positive enters the literature and misdirects work for years, while a missed effect can be found again. But the weighting is not a law of nature, and there are settings where it is backwards. Screening for a dangerous side effect, testing whether a bridge design is unsafe, checking whether a crisis indicator is flashing: in each, the false negative is the catastrophe and the false positive merely an inconvenience, and a rational decision-maker would run the seesaw the other way, tolerating many false alarms to miss nothing. The same reversal appears wherever prediction is the product: the classification models of machine learning in econometrics and the logit and probit models that assign probabilities to defaults, frauds, and recessions all face the identical trade-off under different names, false positive rate against false negative rate, and tune the threshold to the costs of each mistake rather than to a universal 5 percent. Economics could often do the same, and the habit of asking “which error is expensive here?” before adopting any threshold is the single most transferable lesson the framework offers.
Reading Results With Both Errors in Mind
For a consumer of empirical claims, the framework converts into three protections. First, translate “statistically insignificant” correctly: it means the test failed to reject, which is compatible with no effect and equally compatible with an effect the study lacked power to see; treating it as proof of absence is a Type II error laundered into a conclusion, and the honest check is whether the study had a realistic chance of detecting effects of plausible size. Second, remember that a 5 percent error rate applies per test: a researcher or a literature running twenty independent tests should expect one false positive among them by construction, which is why single unreplicated findings deserve provisional belief and why the selective-reporting pathologies discussed alongside significance conventions matter so much. Third, watch the base rate: in fields where true effects are scarce, even a strict alpha lets false positives outnumber true detections among the published rejections, a piece of conditional-probability arithmetic that the Bayesian reasoning covered in our article on Bayesian econometrics makes explicit. None of these protections requires distrusting statistics; they require remembering that a test is a decision procedure with two known failure modes, only one of which is ever printed in the table.
MASEconomics Explains
3 economic concepts behind Type I and Type II errors
These concepts are explored in depth across our educational articles library.
Explore the MASEconomics BlogConclusion
Type I and Type II errors are the complete inventory of ways a hypothesis test can fail: announcing what is not there, and missing what is. Their rates sit on a seesaw governed by the evidence available, the significance convention fixes the false-positive side at 5 percent while letting the false-negative side float, and power, the neglected half of the framework, is where studies are actually won or lost, since an underpowered design mostly misses real effects and exaggerates the ones it catches. The courtroom analogy holds throughout, including its moral: the asymmetry between the two mistakes is a choice about costs, made by convention on behalf of every user of the 5 percent threshold.
The framework’s lasting value is the question it installs: which error is expensive here? Science policing its literature answers one way; a screen for catastrophe answers the other; a classifier pricing defaults answers with a cost-tuned threshold and no reverence for 5 percent at all. Readers equipped with that question stop treating insignificance as absence, stop treating single findings as facts, and start asking whether a study could have seen what it claims not to have found, which is most of what separates statistical literacy from statistical ritual.
Frequently Asked Questions
What are Type I and Type II errors in simple terms?
A Type I error is a false positive: the test declares an effect that does not actually exist. A Type II error is a false negative: a real effect exists but the test fails to detect it. In the courtroom analogy, they are convicting the innocent and acquitting the guilty, and every testing procedure risks both.
Which error is worse?
It depends entirely on the costs of the setting. Scientific convention treats the false positive as worse, because a wrong finding pollutes the literature, and fixes its rate at 5 percent. In safety screening or crisis detection the false negative is the catastrophe, and a rational threshold tolerates many false alarms instead. The right question is always which mistake is expensive here.
How can both error rates be reduced at the same time?
Only with more or better evidence: larger samples, less noisy measurement, stronger research designs, or bigger true effects. With the data fixed, the two rates trade off, since any stricter rejection bar that reduces false positives also makes genuine effects harder to detect.
What is statistical power?
The probability that a test detects an effect of a given size when it truly exists, equal to one minus the Type II error rate. Researchers can compute in advance the sample needed to reach adequate power for the smallest effect worth caring about, and studies that skip this step tend to miss real effects and exaggerate the ones they find.
Does an insignificant result prove there is no effect?
No. Failing to reject the null means the data did not provide enough evidence, which happens both when no effect exists and when a real effect meets an underpowered test. Absence of evidence is evidence of absence only when the study had high power to detect effects of the size that would matter, which is exactly the question to ask of any null result.
Thanks for reading! Every test can convict the innocent or free the guilty; statistical literacy is remembering the second one is never printed. Happy learning with MASEconomics