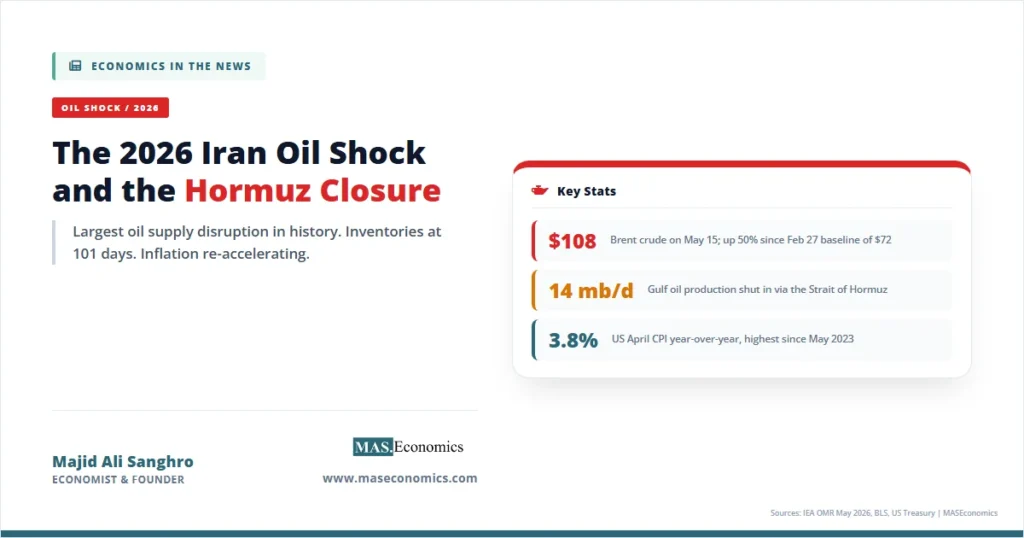
The 2026 Iran oil shock began on February 28, 2026, when joint US-Israeli strikes against Iran opened a regional war that, within seventy-two hours, pushed Brent crude from $72 a barrel to triple digits and, within six weeks, rendered the Strait of Hormuz functionally closed. By mid-May, the International Energy Agency had logged cumulative supply losses of more than 1 billion barrels, the largest oil supply disruption in market history, with North Sea Dated crude averaging $120.36 a barrel in April and Brent trading at $108 on the day of President Trump’s summit with Chinese President Xi Jinping in Beijing.
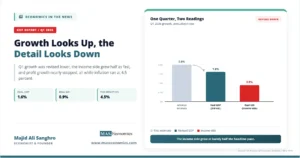
The shock matters because of its scale, its duration, and the fact that it landed on an economy still carrying sticky services inflation from the post-pandemic cycle. The April US CPI rose 0.6 percent month over month, lifting annual inflation to 3.8 percent, the highest reading since May 2023. The 30-year US Treasury yield closed at 5.12 percent on May 15. Federal Reserve rate-cut probability for the rest of 2026 has collapsed to near zero, with markets pricing a 20 to 30 percent chance of a hike. The 2026 Iran oil shock is now the central macroeconomic story of the year, displacing the trade and tariff narratives that dominated 2025.
What Happened and When
The war’s first day was a Saturday, with markets closed. By Monday, March 2, Brent was at $95. By March 9, when Iranian oil facilities were hit for the first time, Brent surged to nearly $120, a level last seen in mid-2022. Trump declared the spike “a small price to pay” for the campaign objective. The price increase of 51 percent in March was among the largest one-month oil price rises on record, comparable to October 1973 and August 1990. The pattern in those previous shocks was a sharp initial spike followed by a slower fade as substitution and demand destruction set in. The 2026 episode has not faded.
The reason is the Strait of Hormuz. As we set out in our piece on how a 40-kilometre chokepoint is holding the global economy hostage, the strait carries roughly 20 to 21 million barrels a day of crude and refined products in a normal year, or about a fifth of all seaborne oil. The US Energy Information Administration confirmed that flows fell from 20.4 million barrels a day in the first quarter of 2025 to 14.6 million in the first quarter of 2026, a 5.8 million barrel-a-day reduction. By the May 2026 IEA Oil Market Report, Gulf production was 14.4 million barrels a day below pre-war levels and more than 14 million barrels a day of Gulf output sat shut in.
Iran answered the strikes by attacking shipping and energy infrastructure across the Gulf. The United Arab Emirates, Iraq, and Kuwait cut output as storage filled. Insurance for tanker traffic through the strait became prohibitively expensive. Qatar’s energy minister, Saad al-Kaabi, warned that continued fighting could halt Gulf energy exports entirely and push oil to $150 a barrel. The IEA framed the cumulative effect as an “unprecedented supply shock.”
The first ceasefire collapsed within weeks. By May 4, Iranian drones struck UAE territorial waters, and the US sank Iranian vessels in the strait. Brent settled above $114 on May 4 alone, a single-day gain of 6 percent. By May 11, with Trump publicly calling the ceasefire “on massive life support,” Brent closed at $104.21. By May 14, the IEA confirmed crude and fuel flows through the strait had fallen by 4 million barrels a day in March and April combined. By May 15, with Trump in Beijing, Brent was at $108. The war has now produced more than ten weeks of continuous supply disruption, longer than any episode since 1990.
The Hormuz Closure in Hard Numbers
| Date | Event | Brent ($/bbl) | Market Signal |
|---|---|---|---|
| Feb 27, 2026 | Pre-war baseline; markets calm | 72 | Pre-shock equilibrium |
| Feb 28, 2026 | Joint US-Israel strikes begin | Markets closed | Saturday open; gap higher into Monday |
| Mar 2, 2026 | First trading day after strikes | ~95 | 32% one-day shock |
| Mar 9, 2026 | Iranian facilities hit; UAE/Iraq/Kuwait cut output | ~120 | 1990-scale spike |
| Mar 24, 2026 | Philippines declares energy emergency | ~115 | First sovereign emergency |
| Apr 22, 2026 | Ceasefire extended; Iran seizes two ships | 101.91 | Diplomacy fails to reopen strait |
| Apr 28, 2026 | World Bank Commodity Markets Outlook | ~110 | Energy prices +24% forecast for 2026 |
| May 4, 2026 | Iranian drones strike UAE; US sinks Iranian vessels | 114.50 | “Ceasefire has ceased” |
| May 11, 2026 | Trump dismisses Iran counteroffer as “garbage” | 104.21 | Ceasefire on “massive life support” |
| May 12, 2026 | US April CPI: 3.8% YoY, highest since May 2023 | ~107 | Inflation re-acceleration confirmed |
| May 14-15, 2026 | Trump-Xi summit, Beijing | ~108 | China commits to push for Hormuz reopening |
 | |||
The defining feature of this shock is not the price level but the inventory depletion behind it. According to the May 2026 IEA report, global observed inventories fell by 129 million barrels in March and another 117 million in April, or roughly 4 million barrels a day on average. Global oil stocks, including crude and refined products held both on land and at sea, are estimated at about 101 days of demand and could fall to 98 days by end of May, according to Goldman Sachs. Saudi Aramco chief executive Amin Nasser told investors on the company’s first-quarter earnings call that if the strait reopens immediately, normalisation will still take months; if reopening is delayed past mid-June, the market will not rebalance until 2027.
The Inflation Pass-Through
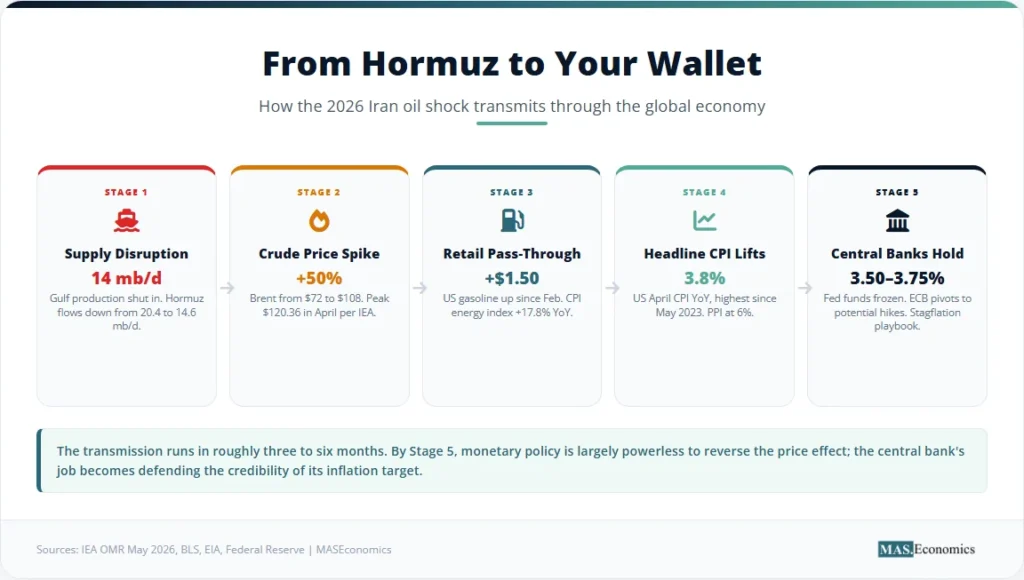
The transmission from crude prices to consumer inflation has been textbook in its directness. Our explainer on why energy crises keep coming back describes the standard pathway: a 10 percent rise in crude tends to add roughly 0.4 percentage points to headline CPI within three months, with secondary effects on transport, aviation, and chemical inputs accruing over six to nine months.
The April US data confirms the first leg of that pass-through. The energy index rose 3.8 percent in April alone and accounted for over 40 percent of the monthly all-items increase. Compared with a year earlier, energy was up 17.8 percent, and the gasoline index was 28.4 percent higher. Wholesale prices, which lead consumer prices by roughly one quarter, surged 1.4 percent month over month in April, almost triple the 0.5 percent consensus, lifting the annual PPI rate to 6 percent, the highest since early 2022. The picture is one of an energy shock now propagating into core goods through input costs.
The pattern is global. France’s first-quarter unemployment rate rose to 8.1 percent, the highest since 2021, on near-stagnant growth. South Africa, India, Thailand, and Taiwan face localised product scarcity in refined fuels, particularly jet fuel and petrochemical feedstocks, according to Goldman Sachs. The European Central Bank’s chief economist, Philip Lane, has publicly said the global oil shock could force the ECB to raise rates as soon as June, despite a Eurozone economy that grew just 0.1 percent in the first quarter of 2026. A Bloomberg survey published May 11 found economists expect the ECB to hike twice in 2026, a sharp reversal from the consensus of one cut held only a month earlier.
Central Banks Caught in the Stagflation Trap
Every major central bank has now been pulled toward a hawkish bias by the shock. The Federal Reserve under outgoing chair Jerome Powell held rates at 3.50-3.75 percent at the April 29 meeting, with three dissents arguing for no further cuts. The succession of Kevin Warsh as Fed chair on May 15 has hardened that posture. Market pricing now implies a 97 percent probability of a hold at the June 16-17 FOMC, with rate-hike odds at 20 percent for October and 30 percent for December. Our full read on the transition is in Powell’s final rate decision.
The Bank of England faces a similar bind in a weaker domestic economy. The ECB held rates at its April 30 meeting after rejecting both a hike and a cut, with President Lagarde noting the bank was “certainly moving away” from its baseline scenario. The Bank of Canada and Reserve Bank of Australia have paused their cutting cycles. The pattern across the developed world is the textbook supply-shock response: when inflation is driven by a negative supply shock rather than excess demand, monetary policy is largely powerless to lower prices without imposing severe output costs.
The theoretical foundation is set out in our piece on how the monetary transmission mechanism works. Higher policy rates compress aggregate demand by raising the cost of credit and reducing asset values, but neither effect produces more oil. The central bank’s actual role in a supply shock is to prevent second-round effects from materialising in wages and long-term inflation expectations. That is why the relevant data point now is not the spot oil price but the five-year-five-year forward inflation expectation, which has risen by roughly 50 basis points since February. The Fed and the ECB are not fighting inflation so much as defending the credibility of their inflation targets.
The Treasury market has priced this directly. The 30-year US yield closing at 5.12 percent on May 15 is the highest since May 2025 and reflects a sharp rise in both the inflation risk premium and the term premium. Our explainer on what bond markets tell us walks through how to read these signals. The bear steepening of the US curve — with the long end rising faster than the short end — is the classic signature of a supply-shock regime in which the central bank is expected to hold rates restrictive while long-run inflation expectations drift higher.
The Brent Path That Defines 2026
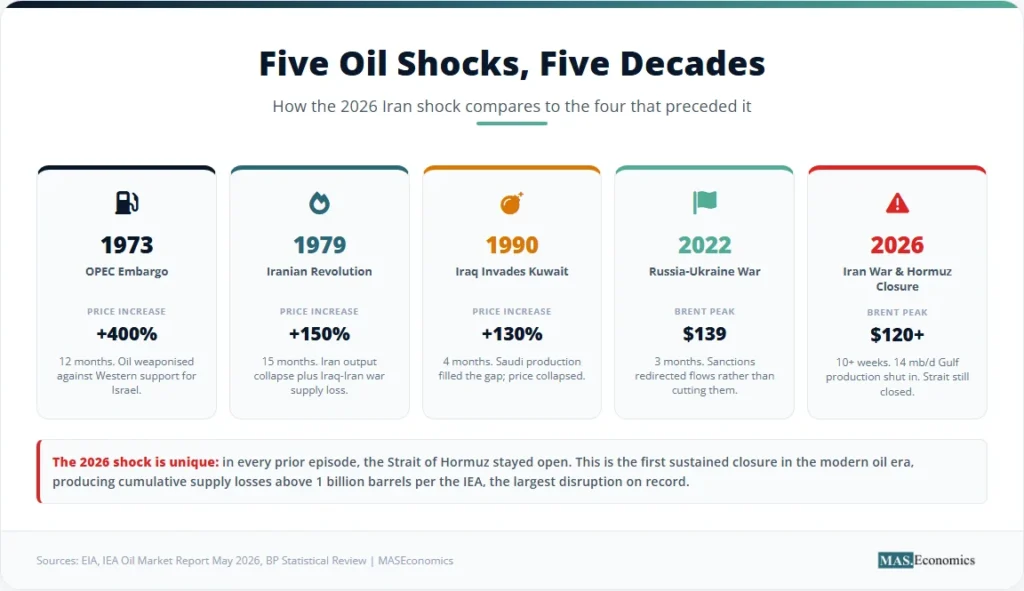
The trajectory is best understood against the four prior shocks that defined the modern oil era. The 1973 OPEC embargo lifted nominal crude prices by 400 percent over twelve months. The 1979 Iranian Revolution drove a 150 percent increase over fifteen months. The 1990 Iraqi invasion of Kuwait produced a 130 percent spike within four months before the price collapsed once Saudi production filled the gap. The 2022 Russia-Ukraine response saw Brent peak at $139 a barrel before settling. The 2026 shock has so far traced a path closer to 1990 in speed and to 1973-79 in duration. The defining variable is the Strait of Hormuz: in every prior episode, the chokepoint stayed open. This time, it has not.
The Trump-Xi Summit and the China Variable
The May 14-15 summit between President Trump and Chinese President Xi Jinping in Beijing was framed by both sides as a working session, but the underlying calculation centred on the strait. China is the largest single importer of Iranian crude, takes roughly 70 percent of Gulf oil flowing through Hormuz when shipments are flowing, and holds the largest strategic reserves of any non-OECD economy. Beijing has the leverage to pressure Tehran in ways Washington cannot. Trump arrived in Beijing publicly demanding that Xi push Iran to reopen the strait.
The summit produced three explicit deliverables on energy. First, China agreed to begin purchasing US crude in significant volume, with Trump announcing that Chinese tankers would call at Texas, Louisiana, and Alaska terminals. Second, China publicly endorsed the reopening of the Strait and called for a “comprehensive and lasting ceasefire” in the Middle East. Third, Beijing committed not to supply military equipment to Tehran during the active conflict. The summit communique was carefully worded to avoid framing these commitments as concessions but the energy substance is significant.
The complication is what Beijing extracted in return. Analysts had widely expected China to demand US concessions on Taiwan in exchange for Iran pressure. The summit’s published outputs do not detail those concessions in full, but the agenda’s framing of a “new positioning” for the bilateral relationship leaves room for adjustment on technology export controls, semiconductor restrictions, and rare-earth flows. The context is the deep US-China economic interdependence we covered in our earlier reading of the Trump-China visit.
The market response was muted. Brent held near $108 through the summit. The yuan firmed modestly against the dollar. The lack of an immediate price decline reflects the IEA’s published view: even if shipping through the strait gradually resumes from June, the market will not rebalance within 2026. Saudi Aramco’s CEO has stated explicitly that normalisation runs into 2027 if reopening is delayed past mid-June. The summit may have lowered the tail risk of escalation, but it did not change the inventory math. That math now drives every other variable in the global economy.
Where Domestic Politics Meets the Pump
The shock has translated directly to retail gasoline prices in the United States, which have risen roughly $1.50 a gallon since late February. The April Retail Sales release showed nominal spending up 0.5 percent month over month, but with gasoline stations accounting for a 2.8 percent share-weighted rise that mechanically masks weaker volume. PNC Financial economists report that households are spending tax refunds at a faster pace than in prior cycles. Consumer confidence hit an all-time low in early May. Real consumption growth, the engine behind two-thirds of US GDP, expanded at only 1.6 percent annualised in the first quarter, down from 1.9 percent in the final quarter of 2025.
The political pressure on Trump has been visible. The administration has floated a federal gasoline tax holiday, an idea opposed by the trucking and construction industries on the grounds that gas taxes fund highway maintenance. The White House has called publicly for the Federal Reserve to cut rates, an argument now harder to make given the April inflation data. The president’s net approval rating has fallen to the lowest of his second term, according to the CNBC All-America Economic Survey. The 2026 midterm elections sit roughly six months out, and the historical pattern in midterms following oil shocks is unfavourable for the incumbent party.
The broader dynamic is the one we wrote about in the economic cost of presidential rhetoric during the Iran crisis: every escalatory statement from the White House moves oil prices, every conciliatory one moves them back, and the cumulative effect of that volatility raises the option-implied uncertainty embedded in long-dated commodity contracts. That volatility itself is a tax on global investment.
The Lessons This Shock Is Teaching
Three propositions follow from what the 2026 Iran oil shock has revealed about the global energy system. None are forecasts. All are testable against the data of the next twelve months.
The first proposition is that strategic reserves were under-built for the scale of the shock that has actually arrived. Goldman Sachs estimates global oil stocks at about 101 days of demand and falling. The IEA confirms inventory drawdowns of about 4 million barrels a day. The post-1973 inventory regime was designed for a 90-day disruption of OECD demand, not a 30-percent reduction in Hormuz flows for an indefinite period. The investment case for sovereign strategic reserves, criticised as wasteful through the cheap-oil decade of the 2010s, now looks vindicated. Expect renewed political support for replenishing the US Strategic Petroleum Reserve and analogous Asian programmes.
The second proposition is that the 2026 shock has compressed the timetable for energy transition decisions in importer economies without accelerating them. European countries have responded by restarting coal plants and pushing back EV mandates, not by accelerating renewable buildouts. India and China have leaned into long-term contracts with Russia, the Americas, and West Africa. The Strait of Hormuz blockade is teaching the same lesson the 1973 embargo taught: in a real shock, the marginal substitution that policymakers count on does not happen at the speed the energy-transition models assume. The political response is to diversify suppliers, not to leave hydrocarbons.
The third proposition is that the Federal Reserve and the ECB will now run policy with more weight on inflation expectations than on output. The framework reviews now underway at both institutions will likely abandon the average inflation targeting regime adopted in 2020. The lesson policymakers have drawn is that flexibility in the inflation target can be exploited by a supply shock to entrench higher long-run inflation. That regime change will outlast the Iran war itself.
MASEconomics Explains
Four concepts behind the 2026 oil shock
These concepts are explored in depth across our educational articles library.
Explore the MASEconomics BlogConclusion
The 2026 Iran oil shock is now the defining macroeconomic event of the year, displacing the trade and tariff narratives that opened the cycle. Brent crude has averaged above $100 a barrel since early March, peaked above $120 in April, and traded at $108 on May 15 as President Trump met President Xi in Beijing. The Strait of Hormuz remains functionally closed to commercial traffic. The IEA records cumulative supply losses exceeding 1 billion barrels, the largest in market history. Global inventories are drawing at roughly 4 million barrels a day.
The April US CPI rose 3.8 percent year over year, the fastest since May 2023. The US PPI rose 6 percent, the fastest since early 2022. The 30-year Treasury yield closed at 5.12 percent. The Federal Reserve has held its target range at 3.50-3.75 percent through the transition from Powell to Warsh, with markets now pricing rate hikes rather than cuts for the rest of 2026. The ECB and the Bank of England have moved from cutting cycles to data-dependent holds. Saudi Aramco’s chief executive has confirmed that even the immediate reopening of the strait would leave the market unbalanced into 2027. The shock has set in motion changes in central bank frameworks, strategic reserve policy, and energy-transition timetables that will outlast the war itself.
Thanks for reading! If you found this helpful, share it with friends and spread the knowledge. Happy learning with MASEconomics