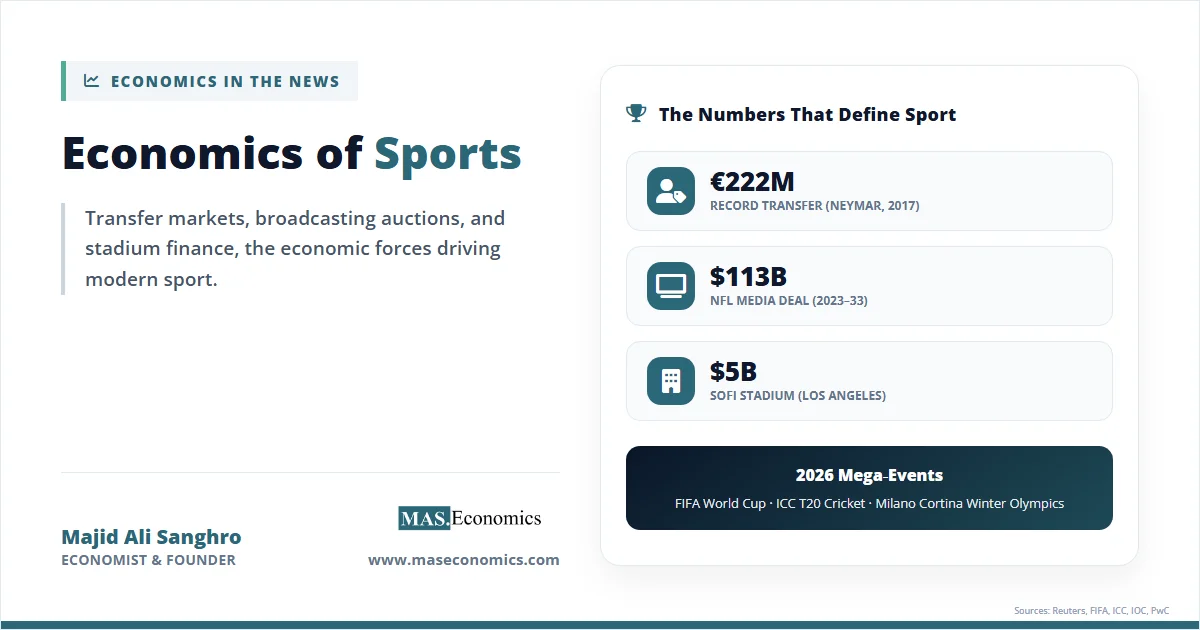
In 2017, Paris Saint-Germain paid a world-record €222 million transfer fee to sign Neymar from Barcelona, shattering the previous benchmark by more than double. Seven years later, the NFL quietly finalised a set of eleven-year broadcasting agreements worth roughly $113 billion with Disney, Fox, CBS, NBC, and Amazon. A year before that, SoFi Stadium in Los Angeles opened its gates at an estimated construction cost of $5 billion, the most expensive sports venue ever built. These three numbers, separated by continents and disciplines, tell a single story: the modern economics of sports is no longer a niche corner of the leisure industry. It has become a flagship of global capitalism, where labour markets, auction theory, and public finance collide with results visible to billions of viewers.
As the world prepares for the FIFA World Cup 2026 across North America, the ICC Men’s T20 World Cup in India and Sri Lanka, and the Milano Cortina 2026 Winter Olympics, the business of sport is reaching unprecedented heights. The three events will, between them, touch an estimated cumulative audience of over five billion viewers and generate tens of billions of dollars in direct economic activity. They also concentrate, within a twelve-month window, every major question that economists have asked about sport for a century: how is talent priced, who captures the broadcast surplus, and do stadiums pay their way for the cities that build them.
$600 Billion Global Industry
The transformation of sport into a global industry has been rapid and uneven. In the nineteenth century, most organised sport was amateur by design: the English Football Association was founded in 1863, the modern Olympic Games were revived in 1896 under an explicit amateurism charter, and cricket’s county game excluded professionals from captaincy until 1952. Money entered slowly, first through gate receipts, then sponsorship, and finally the two revenue pillars that now dwarf everything else: broadcast rights and commercial partnerships.
The global sports market, measured by direct revenues, is estimated at roughly $600 billion annually by PwC’s Global Entertainment and Media Outlook, with the United States alone contributing above $100 billion. The inflection points along the journey are worth tabulating because each one redrew the boundaries of what was economically possible.
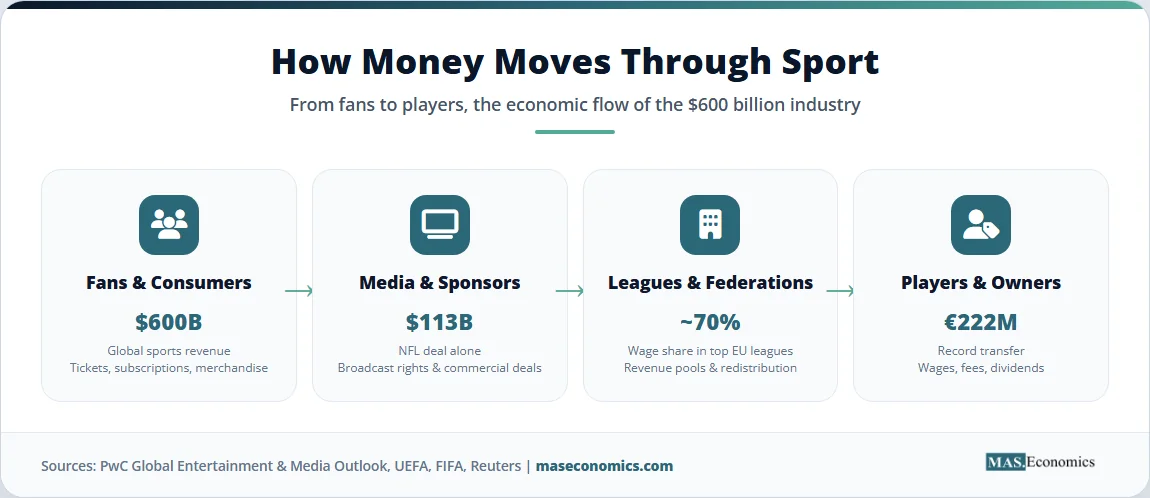
Table 1. Milestones in the Economics of Sports: Eight decades of structural change
| Year | Event | Why It Mattered |
|---|---|---|
| 1961 | US Sports Broadcasting Act passed | Granted antitrust exemption allowing leagues to pool TV rights, creating the model for collective bargaining with networks. |
| 1975 | MLB arbitration ends the reserve clause | Seitz ruling created free agency in US baseball, shifting bargaining power toward players and triggering wage inflation. |
| 1984 | Los Angeles Olympics turn a profit | Private funding and broadcast-led model produced a $215 million surplus, ending the perception that Olympics always lose money. |
| 1992 | English Premier League breaks away | Clubs capture TV revenue directly through a £304 million, five-year Sky deal that transformed English football finance. |
| 1995 | Bosman ruling in European football | European Court of Justice ended transfer fees for out-of-contract players, reshaping continental labour markets. |
| 2008 | Indian Premier League launches | Cricket’s first franchise T20 league auctioned a ten-year media deal worth roughly $1 billion, proving cricket’s broadcast power. |
| 2017 | Neymar transfer hits €222 million | Doubled the world record overnight, exposing the absence of binding cost controls in global football. |
| 2021 | NFL signs $113 billion media package | Largest single-sport broadcast deal in history; confirmed that live sport is the last scarce asset in streaming-era television. |
 | ||
Two patterns stand out. First, every structural leap has been driven by a change in property rights over either labour (the Seitz ruling, Bosman) or broadcast output (the 1961 Act, the Premier League breakaway). Second, the intervals between leaps have shortened. The gap between the 1975 free-agency ruling and the 1992 Premier League breakaway was seventeen years; the gap between the 2017 Neymar transfer and the 2021 NFL mega-deal was just four. The economics of sports is accelerating.
Economic Drivers of Modern Sports
Four frameworks explain most of what happens inside this industry. Taken together, they convert what looks like a parade of eye-watering numbers into something closer to a coherent market system.
Labour Markets and Monopsony Power
In a competitive labour market, wages are set by the intersection of supply and demand across many employers. Professional sports leagues systematically depart from this model. A rookie basketball player in the NBA cannot sell his services to the highest bidder; he enters a draft where a single team acquires exclusive negotiating rights for four years. A first-round pick’s salary is capped by a rookie scale, and the team holds a unilateral option on his fifth and sixth years under restricted free agency rules. This is a textbook example of monopsony, a market with many sellers and one buyer, and it transfers surplus from workers to teams.
European football solved the same problem in the opposite direction. The 1995 Bosman ruling by the European Court of Justice held that transfer fees for out-of-contract players violated the EU’s free movement of workers provisions. Overnight, top players gained the right to walk away at the end of their contracts, and wages surged as clubs bid against one another. The economic prediction is clear: remove monopsony, and labour’s share of revenue rises. UEFA’s club licensing data confirms that wages now absorb around 70 percent of top-division revenue in several European leagues, compared to the roughly 48 percent hard cap negotiated in the NBA.
The comparison between American and European systems illustrates a deeper point about economic institutions. Closed leagues such as the NFL, NBA, and MLB combine monopsony on the labour side with geographic monopoly protection for franchises, which insulates teams from competitive entry and allows them to retain a larger share of league revenue. Open leagues, such as the English football pyramid, impose promotion-and-relegation discipline, which forces clubs to spend aggressively to avoid demotion. The result is a cross-Atlantic divergence that economists such as Stefan Szymanski have documented extensively: American leagues generate higher profits per franchise, European clubs spend a higher share of revenue on players, and the superstar rents are split differently between owners and athletes in each system.
The transfer market itself creates a further economic puzzle. Unlike in most industries, where a worker’s move between firms is a private labour-supply decision, football transfers involve a three-party negotiation in which the selling club, the buying club, and the player must all agree. This structure generates a quasi-market for human capital that trades at prices far above the present discounted value of wages saved, because the selling club is effectively capitalising the player’s future economic rent. The consequence is that a small number of agents and clubs capture very large fees, and that wage inflation at the top cascades downward through the pyramid, a pattern visible in the transfer spending data presented later in this article.
Auction Theory in Broadcasting Rights
Broadcasting rights are sold through sealed-bid or multi-round auctions, and the theory of how bidders behave in these settings has shaped billion-dollar contracts. When the Premier League auctions its domestic TV rights every three years, it deliberately splits the inventory into packages to ensure competition, because a single-package auction would invite collusion. The 2024 auction for the 2025 to 2029 cycle raised £6.7 billion for UK rights, a record for the competition, with Sky and TNT Sports again as the winning bidders.
Auction theory also warns of the winner’s curse. When multiple bidders estimate the value of an asset with uncertainty, the winner is typically the one who overestimated the most. In sports broadcasting, this manifests when new entrants overpay to disrupt incumbents. BT Group’s 2013 entry into Premier League coverage cost it roughly £738 million over three years, and the unit eventually merged with Warner Bros Discovery’s Eurosport to form TNT Sports after profitability proved elusive. The same dynamic now shapes streaming wars, where Apple, Amazon, and YouTube have each acquired major sports packages at prices that analysts question.
Designing a broadcast auction is itself a non-trivial exercise. Rights holders face a three-part optimisation: maximise revenue, preserve audience reach to protect sponsorship value, and prevent any single buyer from accumulating market power over the sport. The European Commission forced the Premier League to sell at least two packages to separate bidders after competition concerns arose in the late 2000s, and the same no-single-buyer rule now applies in France’s Ligue 1 auctions and in UEFA’s Champions League tenders. Without such interventions, a single dominant broadcaster would hold a pure monopsony position over rights, compressing the prices that leagues can achieve.
The emerging question is whether live sport still commands a scarcity premium in a streaming-dominated media landscape. Traditional linear broadcasting is in structural decline, yet rights fees continue to rise, because the alternative inventory available to advertisers, primarily on-demand programming watched asynchronously with ad-skipping, has even weaker engagement economics. A basketball playoff game attracts simultaneous, ad-receptive viewing at scale, which makes it the last reliable asset for premium CPM sales in commercial television. The economics of that scarcity are likely to intensify rather than diminish through the remainder of this decade.
Winner’s Curse in Mega-Event Hosting
The winner’s curse extends beyond rights auctions. Cities that bid to host the Olympics or the World Cup are, in effect, bidding in a sealed auction where the prize is ambiguous. A much-cited IMF Finance and Development survey by Andrew Zimbalist documents that almost every summer Olympics since 1976 has run materially over budget, with the Oxford Olympics Study by Flyvbjerg and colleagues finding an average cost overrun of 156 percent in real terms. Brazil’s 2014 World Cup cost about $15 billion against projected returns that never fully materialised, and Tokyo 2020 officially cost around $13 billion but third-party audits suggest the true figure was higher.
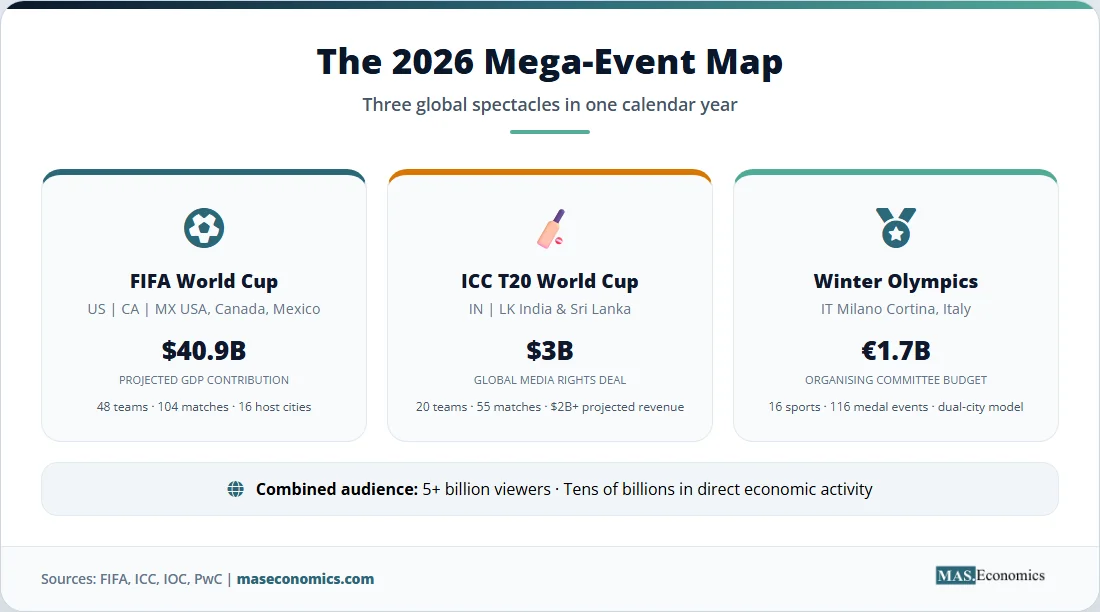
The 2026 lineup is instructive because it pairs three very different host models. Milano Cortina 2026 is using existing venues heavily, with the International Olympic Committee reporting a public subsidy below €1.4 billion, a deliberate response to past overruns. The FIFA World Cup 2026 distributes costs across sixteen host cities in three nations, diluting fiscal risk for any single jurisdiction. The ICC T20 World Cup uses India’s and Sri Lanka’s mature cricket infrastructure, minimising new construction. Each approach represents a different answer to the winner’s curse problem, and each will be examined in a dedicated MASEconomics article closer to kick-off.
Academic attention has increasingly shifted from whether mega-events generate net benefits to how those benefits, such as they are, are distributed across local stakeholders. Tourism receipts flow to hotels and airlines, construction spending accrues to contractors who are often headquartered outside the host city, and media rights revenue sits with the international sporting federation rather than the host nation. The residents who absorb congestion, displacement, and the long-run maintenance cost of newly built stadiums rarely appear in the benefit columns at all. This distributional asymmetry is the central reason that public support for hosting has collapsed in democracies: Hamburg’s 2015 referendum rejection of a 2024 bid, Boston’s withdrawal the same year, and Budapest’s pullout in 2017 all reflected voter scepticism that the accounting would ever balance in their favour.
Game Theory in Leagues and Negotiations
Sport is the purest laboratory for game theory and strategic behaviour. On the field, a penalty kick in football is a near-canonical mixed-strategy Nash equilibrium, and empirical studies of professional kickers find that their left-right-centre frequencies match theoretical predictions within a few percentage points. Off the field, the same logic governs collective bargaining between leagues and player unions, where lockouts and strikes resemble repeated prisoner’s dilemmas in which both sides prefer a settled season but each threatens costly breakdown to improve terms.
Leagues themselves behave as cartels. The NFL, NBA, and Premier League all engage in collective sales of media rights, centralised sponsorship deals, and restrictions on franchise relocation that would be prosecuted in most other industries. That these arrangements survive reflects explicit antitrust exemptions and the argument, first formalised by economist Walter Neale in 1964, that sporting competition requires cooperative production. Without a rival, there is no game. This is the economic logic explored in articles on tacit, formal, and illegal collusion in oligopoly and on price determination in different market structures.
The Money Flows: Key Financial Data
Numbers make the structure visible. The chart below compares the largest active or recently concluded sports broadcasting deals by total contract value, converted to US dollars at the time of signing. Three features stand out: American football dominates, with the NFL package alone larger than the next three combined; live sport remains the only inventory for which both legacy broadcasters and streaming platforms compete head-to-head; and cricket has entered the top tier through the Indian Premier League’s 2022 media rights auction, which fetched roughly $6.2 billion across television and digital.
Source: Reuters, Bloomberg, Premier League, ICC, and league press releases. Values shown in US dollars at the time of signing; deal lengths vary from four to eleven years.
Football transfer spending tells a parallel story. The chart below tracks gross transfer expenditure across Europe’s “big five” leagues over the past twenty years, drawing on data compiled by Transfermarkt and FIFA’s Global Transfer Report. Growth has been exponential rather than linear, punctuated by COVID-era dips in 2020 and 2021, followed by a sharp rebound driven by Saudi Arabian investment in the Pro League and continued Premier League spending.
Source: Transfermarkt and FIFA Global Transfer Report. Figures reflect gross spending across England, Spain, Germany, Italy, and France, converted to euros.
The three 2026 mega-events will add their own spike to these trend lines. Official projections, still subject to revision, are summarised below.
Table 2. The 2026 Mega-Events: Scale and projected economic footprint
| Event | Host Nations | Format | Projected Direct Output |
|---|---|---|---|
| FIFA World Cup 2026 | USA, Canada, Mexico | 48 teams, 104 matches, 16 host cities | Estimated $40.9 billion in aggregate GDP contribution across three nations, per FIFA-commissioned analysis. |
| ICC Men’s T20 World Cup 2026 | India, Sri Lanka | 20 teams, 55 matches | Projected ticketing, tourism, and broadcast revenue above $2 billion, leveraging the Disney Star and JioCinema global rights deal worth roughly $3 billion over four years. |
| Milano Cortina 2026 Winter Olympics | Italy (dual city) | 16 sports, 116 medal events | Organising committee budget of €1.7 billion, with regional GDP impact projected between €4 billion and €5 billion. |
| |||
Standard economic caution applies to every line in the table. Ex ante projections produced by host organisations routinely use gross multiplier methods that double-count substitution effects, as the University of Oxford’s Saïd Business School noted in its Olympic cost study. The true test of these events will be ex post analysis, which MASEconomics will revisit after each concludes.
What Policymakers Can and Cannot Do
Three policy questions dominate the current agenda. The first is stadium finance. American economists have produced a remarkably consistent verdict over three decades: publicly subsidised stadiums deliver little or no net economic benefit to host cities. A Brookings Institution review by Rappaport and Wilkerson concluded that stadium spending generates spending that would have occurred elsewhere locally, so the net regional impact is near zero. Despite this evidence, public subsidies persist, partly because they involve the same strategic bargaining between monopoly franchises and competing cities that characterises other oligopoly behaviour, and partly because cross-border capital flows and foreign direct investment in stadium projects create political incentives separate from pure cost-benefit calculation.
The second question is financial sustainability in player markets. UEFA’s Financial Fair Play regime, tightened in 2022 and renamed as the Financial Sustainability Regulations, caps wages-plus-transfers at 70 percent of revenue by 2025-26 and imposes graduated penalties for breaches. Whether such rules can constrain spending without distorting the Pareto-efficient allocation of talent across clubs remains disputed. Critics argue the caps entrench incumbents by anchoring spending to historical revenue bases; defenders counter that unconstrained spending races threaten the long-run viability of the competition itself.
The third question is the streaming transition. Live sport has become the decisive asset in the competition for subscribers. Amazon’s $1 billion per season Thursday Night Football package, Apple’s $2.5 billion ten-year MLS deal with exclusive streaming rights, and YouTube TV’s NFL Sunday Ticket acquisition all represent structural shifts away from linear broadcast. The welfare consequences are ambiguous. Consumers gain choice but face fragmentation: following Premier League football, the NFL, and the Champions League can require four or five separate subscriptions, with aggregate costs that exceed a traditional cable package. Follow-up MASEconomics articles will explore each of the 2026 events, and the streaming dynamic specifically, in dedicated treatments.
MASEconomics Explains
Four economic concepts behind the economics of sports
Conclusion
The economics of sports is no longer a curiosity on the edge of mainstream economic analysis. A $222 million transfer, a $113 billion broadcasting contract, and a $5 billion stadium are data points in the same system, and they are best understood through the standard tools of labour economics, auction theory, and industrial organisation. The 2026 calendar, with its World Cup, T20 World Cup, and Winter Olympics, will deliver a year of evidence on whether the industry’s latest wave of spending delivers sustained returns or simply repeats the winner’s curse at a larger scale. MASEconomics will return to each of these events, and to the streaming and stadium debates that surround them, in the months ahead.
Did you find this article helpful? Share it with someone who loves economics. And remember, at MASEconomics, we make complex ideas simple.