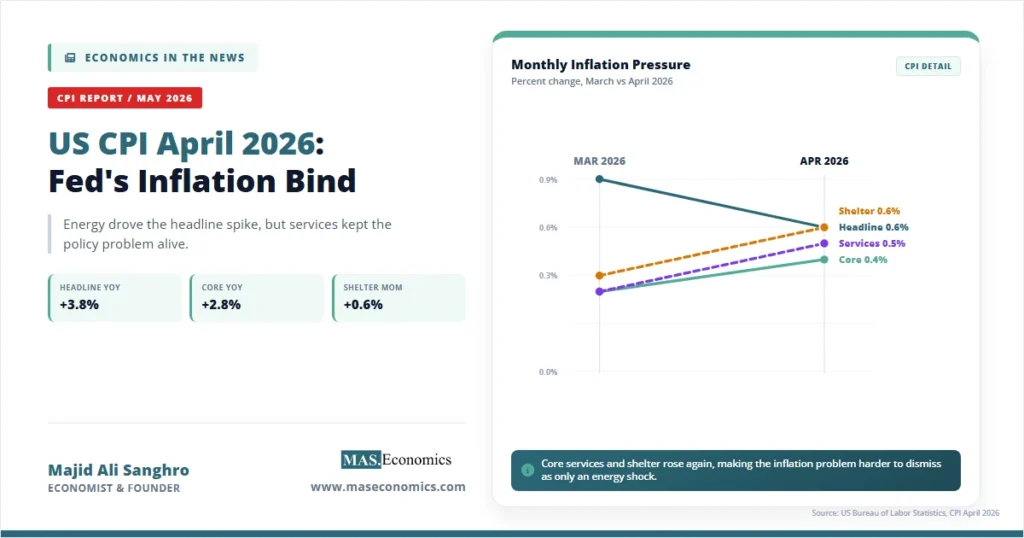
The April inflation report landed on May 12 with a clear message for the Federal Reserve. The US CPI April 2026 release showed headline consumer prices rising 0.6 percent in April after a 0.9 percent increase in March, while the 12-month inflation rate accelerated to 3.8 percent from 3.3 percent. Energy explained much of the monthly pressure, but the deeper policy problem sat in services: shelter rose 0.6 percent, services with less energy rose 0.5 percent, and core CPI rose 0.4 percent after two softer monthly readings.
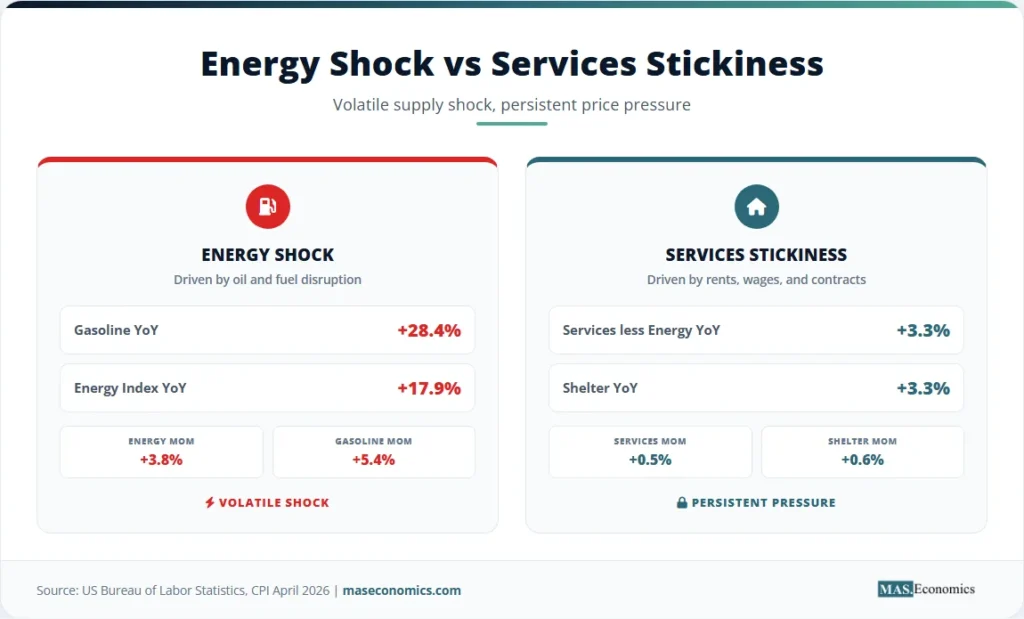
The report did not show a broad return to the 2022 inflation shock. It showed a narrower but still difficult inflation mix. Energy prices were the visible driver, with gasoline rising 5.4 percent in April and 28.4 percent over the year. Core services were the harder problem because they are tied to rents, wages, insurance, travel, household operating costs, and expectations. That composition matters because the Fed can look through a temporary oil shock more easily than it can look through a renewed services impulse.
What April CPI Showed
The Bureau of Labor Statistics reported that the Consumer Price Index for All Urban Consumers increased 0.6 percent in April on a seasonally adjusted basis. Over the prior 12 months, the all-items index increased 3.8 percent before seasonal adjustment, the fastest annual pace since 2023. The report followed a volatile March reading, when headline CPI jumped 0.9 percent as energy costs surged. April was slower than March, but still far above the monthly pace consistent with the Fed’s 2 percent inflation target.
The headline number was heavily affected by energy. The energy index rose 3.8 percent in April and accounted for more than 40 percent of the monthly all-items increase, according to the BLS release. Gasoline rose 5.4 percent over the month, fuel oil rose 5.8 percent, electricity rose 2.1 percent, and the energy index was 17.9 percent higher than a year earlier. Gasoline alone was up 28.4 percent over 12 months. That makes April a classic example of headline inflation being pulled upward by a supply-side energy shock.
Food also moved higher. The food index rose 0.5 percent in April after being unchanged in March. Food at home rose 0.7 percent, with meats, poultry, fish, and eggs up 1.3 percent and fruits and vegetables up 1.8 percent. Food away from home rose only 0.2 percent, which prevented restaurant prices from becoming the main story. Over the year, food prices were up 3.2 percent, food at home was up 2.9 percent, and food away from home was up 3.6 percent.
The policy-sensitive part of the release was core inflation. CPI excluding food and energy rose 0.4 percent in April after rising 0.2 percent in each of the two preceding months. Core CPI was up 2.8 percent over the year, compared with 2.6 percent in March. Within core inflation, the services side carried the concern. Services less energy rose 0.5 percent in April and 3.3 percent over the year. Shelter rose 0.6 percent in April, owners’ equivalent rent and rent each rose 0.5 percent, and lodging away from home increased 2.4 percent.
Goods did not create the same inflation signal. Commodities, less food and energy, were unchanged in April and rose only 1.1 percent over the year. New vehicles fell 0.2 percent, used cars and trucks were unchanged, and medical care commodities declined 0.4 percent. This split between softer core goods and firmer core services is central to the inflation story. It shows that goods disinflation is still working in parts of the economy, but services are not cooling fast enough to give the Fed confidence.
The Importance of Services Inflation
Sticky services inflation is more important than headline energy inflation for monetary policy because it tends to move slowly. Oil and gasoline prices can reverse quickly if supply conditions improve. Service prices are more persistent because they depend on labour costs, rent contracts, insurance pricing, local market conditions, and expectations. A one-month gasoline jump can be discounted by central banks if it does not spill into wages and broader prices. A renewed rise in shelter, travel, personal care, and household services is harder to ignore.
This is why April’s CPI report creates a bind rather than a simple hawkish signal. The all-items index rose 3.8 percent over the year, but a large share came from energy. If the Fed reacts aggressively to an energy shock, it risks tightening into a supply disturbance that interest rates cannot directly fix. Higher interest rates do not produce more oil, reopen disrupted shipping routes, or lower fuel costs overnight. That is the case for patience.
The opposite case is also strong. If the Fed ignores the headline spike while services inflation accelerates, inflation expectations can drift upward. Services, less energy rising 0.5 percent and shelter rising 0.6 percent, are not minor details. Housing has a large weight in CPI, and shelter inflation passes through the index slowly. Owners’ equivalent rent and rent each rising 0.5 percent in April means the largest services category remains too firm for comfort. That reinforces the logic of sticky services inflation: the final mile to 2 percent is difficult because the categories left behind are less responsive to immediate goods-price relief.
The April report also connects directly to the difference between CPI, PCE, and PPI inflation reports. CPI gives heavier weight to out-of-pocket consumer prices, especially shelter, while the Fed formally targets PCE inflation. Even so, CPI matters because it shapes household expectations, wage bargaining, market pricing, and the political environment around the central bank. A CPI report with a 3.8 percent headline rate and 0.4 percent core monthly reading weakens the case for near-term easing even before the PCE report arrives.
The services problem is also linked to the Phillips Curve. In a standard Phillips Curve framework, inflation pressure should fade as labour-market slack rises. The April jobs report showed payroll gains of 115,000, unemployment at 4.3 percent, and wage growth at 3.6 percent. That is a slower labour market, but not a collapsed one. Services inflation remaining firm while wage growth slows only gradually leaves the Fed in an uncomfortable middle: labour demand is no longer overheated, but it is not weak enough to guarantee fast disinflation.
Pre‑April Inflation Context
The April CPI report came after several months of mixed inflation signals. December 2025 CPI rose 0.3 percent, January rose 0.2 percent, February rose 0.3 percent, March jumped 0.9 percent, and April rose 0.6 percent. Core CPI looked more stable before April, rising 0.2 percent in December, 0.3 percent in January, 0.2 percent in February, 0.2 percent in March, and 0.4 percent in April. The sudden April core acceleration is the reason the release cannot be dismissed as an energy-only event.
The global backdrop made the report more difficult. The Fed’s April 29 statement explicitly said inflation was elevated, in part reflecting higher global energy prices, and that Middle East developments were contributing to a high level of uncertainty. The FOMC held the target range for the federal funds rate at 3.50 to 3.75 percent. The statement also said the Committee would carefully assess incoming data, the evolving outlook, and the balance of risks. April CPI became exactly the kind of incoming data that complicates the balance of risks.
Inflation expectations added another layer. The New York Fed’s April Survey of Consumer Expectations found that median one-year-ahead inflation expectations rose 0.2 percentage points to 3.6 percent, while three-year and five-year expectations held at 3.1 percent and 3.0 percent. That pattern is not an unanchoring of long-run expectations, but it shows rising near-term household concern. The University of Michigan survey also reported weak consumer sentiment and still-elevated year-ahead inflation expectations in early May. The inflation psychology is not as severe as in 2022, but it has moved in the wrong direction.
The labour market backdrop also matters. The US jobs report April 2026 showed a labour market that is slowing but still producing jobs. Payrolls rose 115,000, the unemployment rate held at 4.3 percent, and average hourly earnings rose 3.6 percent year-over-year. The result gave the Fed no obvious labour-market reason to cut rates quickly. It also gave the Fed no clear reason to hike immediately. The inflation report now pushes the policy debate toward a longer hold.
The broader macro context fits within the structure of the US economy. A services-heavy economy is harder to disinflame once services categories reaccelerate. Goods prices can fall when supply chains normalise, or inventories rebuild. Service prices often require weaker demand, lower wages, lower rents, or better productivity growth. That is why the April CPI report is not just a gasoline story. It is a test of whether the US economy can absorb an energy shock without reigniting the services inflation process.
The Inflation Data in Detail
The monthly data show the pattern more clearly than the annual headline alone. March was dominated by energy, with the energy index rising 10.9 percent and gasoline rising 21.2 percent. April was less extreme but broader. Energy still rose 3.8 percent, food rose 0.5 percent, core rose 0.4 percent, services less energy rose 0.5 percent, and shelter rose 0.6 percent. A slowdown from March’s headline spike does not mean inflation became comfortable.
The chart shows two separate signals. The first is the energy-led headline shock in March and April. The second is the April rise in services and shelter, which matters more for the Fed’s medium-term inflation assessment. Core CPI did not move much in March because the most volatile energy prices are excluded from core. In April, core moved up because services and shelter strengthened. That shift is the reason April’s report is less reassuring than a headline-only reading would suggest.
| Component | April 2026 MoM | March 2026 MoM | 12-Month Change | Policy Signal |
|---|---|---|---|---|
| All items CPI | +0.6% | +0.9% | +3.8% | Headline inflation still too high |
| Core CPI | +0.4% | +0.2% | +2.8% | Core progress slowed |
| Energy | +3.8% | +10.9% | +17.9% | Supply shock dominates headline |
| Gasoline | +5.4% | +21.2% | +28.4% | Household budget pressure rising |
| Food | +0.5% | 0.0% | +3.2% | Essential prices remain firm |
| Services less energy | +0.5% | +0.2% | +3.3% | Sticky inflation risk increased |
| Shelter | +0.6% | +0.3% | +3.3% | Rent pass-through still persistent |

|
||||
The table shows why the Fed’s reaction function is constrained. Headline inflation is too high, but energy explains much of the increase. Core inflation is lower than headline, but the monthly core pace moved in the wrong direction. Services, less energy, and shelter are the bridge between the two stories. They show whether energy pressure is isolated or beginning to pass into the slower-moving parts of the index. April did not prove a full pass-through spiral, but it provided enough evidence to delay any confidence about disinflation.
The Federal Reserve’s Policy Bind
The Federal Reserve is caught between two parts of its mandate. Inflation is above target and has reaccelerated. Job growth is slower, participation has weakened, and underemployment measures are showing strain. In normal conditions, slower labour demand would support rate cuts. In April 2026, the inflation data makes it difficult because the Fed would risk validating price pressure at the same time households are seeing higher gasoline, grocery, and rent costs.
The April 29 FOMC statement already reflected this tension. The Committee held the federal funds rate at 3.50 to 3.75 percent and said it remained committed to maximum employment and 2 percent inflation. Four officials dissented in different ways: Stephen Miran preferred a 25 basis point cut, while Beth Hammack, Neel Kashkari, and Lorie Logan supported holding rates but opposed language that preserved an easing bias. The dissent pattern showed a split over whether the Fed should prepare for cuts or remove dovish language. April CPI strengthens the case of the officials who did not want an easing bias.
The Federal Reserve’s institutional structure matters in this moment. The chair sets the communication strategy, but policy is decided by the FOMC. A hotter CPI report does not automatically produce a rate hike. It changes the burden of proof. Rate cuts now require stronger evidence that energy shocks are temporary, services inflation is cooling, expectations remain anchored, and labour-market weakness is becoming broad enough to threaten maximum employment.
The Taylor Rule helps clarify the tension. In a simplified Taylor Rule, the policy rate rises when inflation exceeds the target and falls when output is below potential. April’s data pushes the inflation term higher while recent labour data pushes the slack term lower. The rule does not give a clean answer because the economy is not sending a clean signal. Inflation argues for tight policy. Slower employment argues against excessive tightening. The result is a longer hold, not an immediate pivot.
Monetary policy lags make the decision harder. The full effect of prior rate increases works through borrowing costs, credit standards, asset prices, investment, and consumption over time. A central bank that reacts too strongly to backward-looking inflation can overtighten just as demand weakens. A central bank that reacts too little can let inflation expectations rise. The April CPI report sits directly inside the dilemma described in monetary policy lags: the data that confirms inflation is often released after the forces behind inflation have already begun to change.
The international comparison also matters. In central bank divergence in 2026, the Fed has had less room to ease than several peers because US inflation has been more persistent and US demand has been more resilient. A CPI report with headline inflation at 3.8 percent and core inflation at 2.8 percent reinforces that divergence. The ECB and Bank of England may be able to focus more on growth weakness if their inflation paths are softer. The Fed cannot do that while US services prices are still firm.
Market and Household Impacts
April CPI affects markets through expected interest rates, real incomes, and inflation uncertainty. Higher inflation reduces the real value of nominal earnings unless wages keep pace. The BLS real earnings release reported that real average hourly earnings decreased 0.5 percent from March to April, seasonally adjusted, as a 0.2 percent increase in average hourly earnings was more than offset by the 0.6 percent CPI increase. That is the household version of the inflation problem. Nominal wages can rise while purchasing power falls.
The distributional effect is uneven. Gasoline, electricity, groceries, and rent absorb a larger share of income for lower- and middle-income households than for high-income households. That means a headline inflation increase driven by energy and essentials can feel more severe than a core inflation number suggests. CPI is an average across a basket. Household inflation is experienced through actual spending patterns. That is why April’s 3.8 percent headline rate is politically and socially more powerful than the 2.8 percent core rate.
Financial markets focus on a different channel. Higher CPI readings reduce the probability of rate cuts and raise the risk that policy remains tight for longer. Bond yields tend to rise when investors expect higher short-term rates or higher inflation compensation. Equities face two pressures: higher discount rates reduce the present value of future earnings, and weaker real incomes can weigh on consumption. The April CPI report therefore matters for both the real economy and financial conditions.
The inflation expectations channel connects households and markets. The New York Fed’s one-year expectation rising to 3.6 percent indicates near-term inflation concern, while stable three-year and five-year expectations show that long-run credibility has not collapsed. That distinction is important. A temporary rise in one-year expectations can be managed if energy prices stabilise. A rise in long-run expectations would be more dangerous because it would suggest households and firms are revising their belief about the Fed’s ability to deliver 2 percent inflation.
This is where inflation expectations become more than a survey concept. If workers expect higher inflation, wage demands can increase. If firms expect costs to remain high, price-setting can become more aggressive. If financial markets expect inflation persistence, long-term yields can rise. The April report does not prove that the dynamic has taken hold, but it raises the risk that another month of high energy and firm services inflation could move expectations further.
Forward‑Looking Indicators for the Fed
The next test is whether April’s service strength persists. A one-month increase in shelter or airfare can be noisy. A sequence of 0.4 to 0.5 percent core services readings would be a different matter. The Fed will watch shelter, owners’ equivalent rent, rent, transportation services, insurance, personal care, household operations, and medical services. The key question is not whether headline inflation falls if gasoline stabilises. The key question is whether the slower-moving parts of CPI return to a pace compatible with 2 percent inflation.
The second test is expectations. The April New York Fed survey showed near-term inflation expectations moving higher, while medium- and longer-term expectations remained steady. The University of Michigan survey showed weak sentiment and still-elevated year-ahead inflation expectations. If those measures stabilise, the Fed can frame the energy shock as temporary. If they rise again, the argument for patience weakens.
The third test is labour-market slack. April payrolls were not weak enough to force immediate cuts, but the composition of job growth was narrow, and participation fell. If future jobs reports show rising unemployment, falling hours, broader layoffs, and weaker wage growth, the Fed’s dual mandate will become more balanced. If payrolls remain positive and services inflation stays sticky, the case for holding rates strengthens.
The fourth test is energy. The energy index rose 17.9 percent over the year, and gasoline rose 28.4 percent. If oil and gasoline prices reverse, headline CPI could slow quickly. If energy costs remain high, the risk is second-round effects: delivery costs, airline fares, food distribution, inflation expectations, and wage claims. The longer energy prices stay elevated, the harder it becomes for the Fed to separate headline inflation from underlying inflation.
The fifth test is PCE inflation. CPI is not the Fed’s official target measure, but it shapes the path into PCE. A hot CPI report can feed expectations for stronger PCE, especially when services prices are firm. If PCE confirms the CPI signal, the Fed’s hold becomes easier to justify. If PCE is softer because of different weights and measurement methods, officials may keep emphasising patience rather than renewed tightening.
MASEconomics Explains
4 economic concepts behind the April CPI report
These concepts are explored in depth across our educational articles library.
Explore the MASEconomics BlogConclusion
The US CPI April 2026 report showed an inflation problem that is narrower than the 2022 shock but still too persistent for Fed comfort. Headline CPI rose 0.6 percent in April and 3.8 percent over the year, with energy explaining a large share of the monthly increase. Core CPI rose 0.4 percent, services less energy rose 0.5 percent, and shelter rose 0.6 percent, which means the policy risk is no longer just gasoline. The Fed’s bind is that inflation remains above target while labour-market momentum is slowing but not breaking. That combination points to a longer hold in interest rates, a higher threshold for rate cuts, and a continued focus on whether service inflation and expectations move back toward the 2 percent path.
Thanks for reading! If you found this helpful, share it with friends and spread the knowledge. Happy learning with MASEconomics