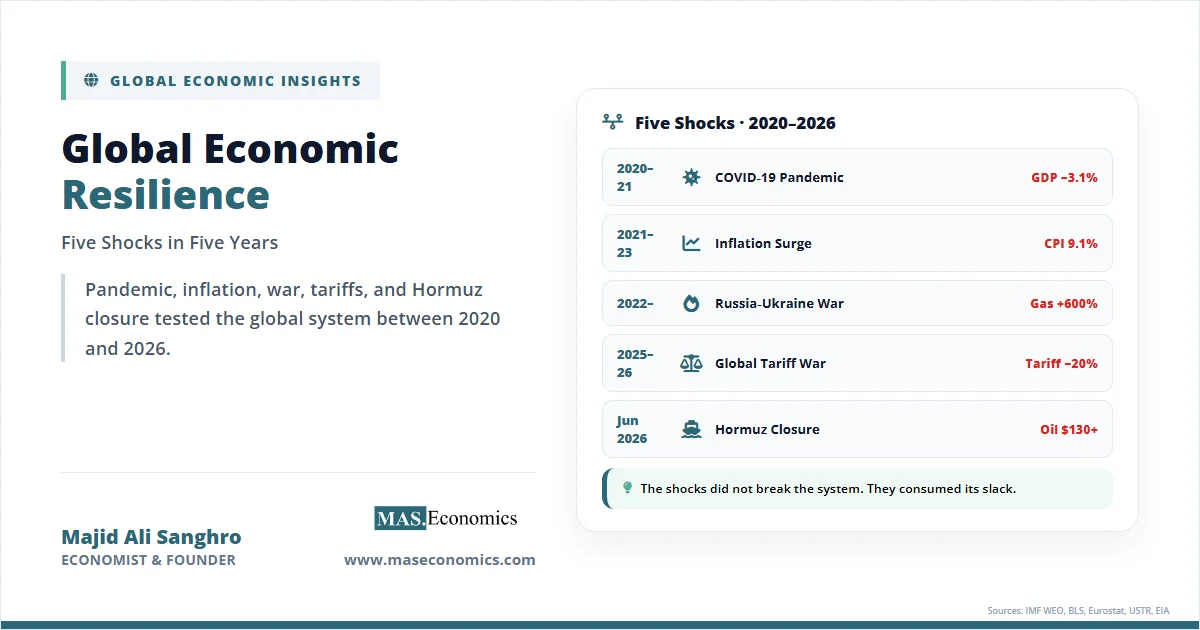
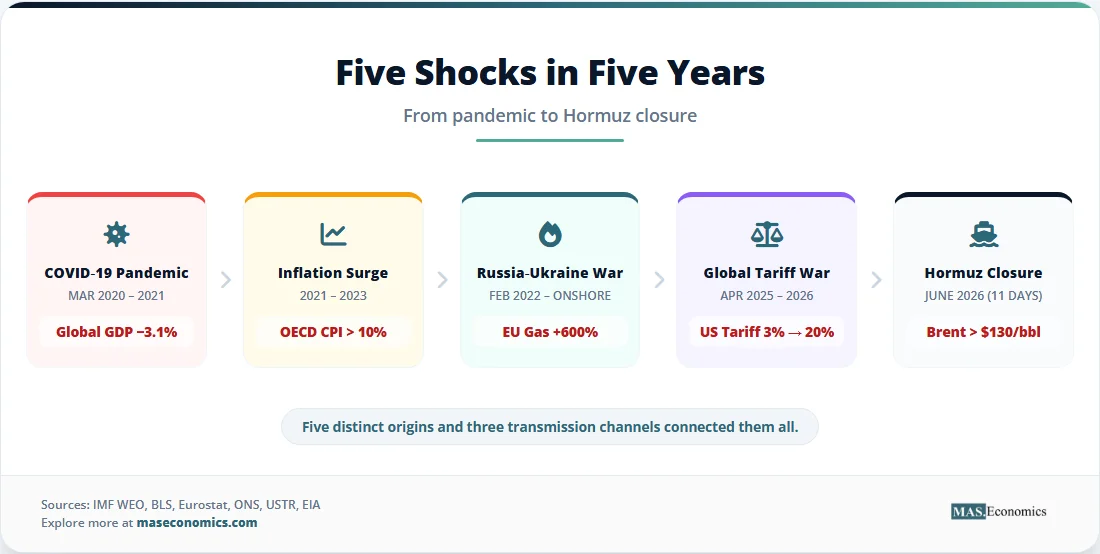
Since March 2020, the world economy has absorbed five distinct shocks in roughly sixty months. The COVID-19 pandemic shut down global production. The 2021–2022 inflation surge pushed headline CPI in the OECD area above 10% for the first time since 1982. The Russia-Ukraine war detonated an energy crisis that lifted European gas prices by more than 600% at their peak. The 2025–2026 tariff escalation rebuilt import barriers to levels not seen since the 1940s. And the June 2026 Strait of Hormuz closure briefly cut off 21% of seaborne crude. Global economic resilience, once a quiet assumption of the post-Cold War order, is now the defining policy question of the decade.
The pattern matters more than any individual event. Five shocks of different origin, transmission, and duration have hit the same global system in close succession. None produced a synchronized world recession, yet each left structural damage. According to the IMF’s World Economic Outlook, global growth in 2026 is running below the 2010–2019 average for the fifth consecutive year. The serial-shock era has not broken the system. It has changed it.
The Five Shocks at a Glance
Each shock had its own mechanism. The pandemic was a simultaneous supply and demand collapse, with global GDP falling 3.1% in 2020 according to World Bank data. The inflation surge that followed combined pent-up demand, fiscal stimulus, and snarled supply chains. By June 2022, US CPI hit 9.1%, eurozone HICP hit 10.6% by October 2022, and the UK peaked at 11.1% in the same month. Central banks responded with the fastest synchronized tightening cycle in forty years.
The Russia-Ukraine war added a commodity shock layered on top. European TTF gas prices spiked above 300 euros per megawatt-hour in August 2022, more than ten times their pre-war average. Wheat futures rose 70% in the first weeks. The trade war that began with the April 2025 reciprocal tariff announcements pushed average US tariff rates from roughly 3% to over 20% by mid-2025, with retaliatory measures from China, the EU, and Canada. The June 2026 Strait of Hormuz closure, lasting eleven days, briefly took Brent crude above $130 a barrel before naval coordination and emergency reserve releases stabilized the market. The mechanics of that episode are detailed in our analysis of the Strait of Hormuz chokepoint.
The table below sets out the five shocks side by side.
Table 1. The Five Shocks: Mechanism, Duration, and Peak Impact
| Shock | Date Range | Primary Mechanism | Peak Impact |
|---|---|---|---|
| COVID-19 Pandemic | Mar 2020 – 2021 | Simultaneous supply and demand collapse | Global GDP −3.1% in 2020 |
| Inflation Surge | 2021 – 2023 | Demand-supply mismatch, fiscal expansion | OECD CPI above 10% (Oct 2022) |
| Russia-Ukraine War & Energy Crisis | Feb 2022 – ongoing | Commodity terms-of-trade shock | EU gas +600%, eurozone recession 2023 |
| Global Tariff War | Apr 2025 – 2026 | Trade policy shock, tariff escalation | US average tariff rose from ~3% to ~20% |
| Strait of Hormuz Closure | Jun 2026 (11 days) | Geopolitical chokepoint disruption | Brent crude above $130/bbl briefly |

|
|||
Sources: IMF World Economic Outlook, BLS, Eurostat, ONS, USTR, EIA.
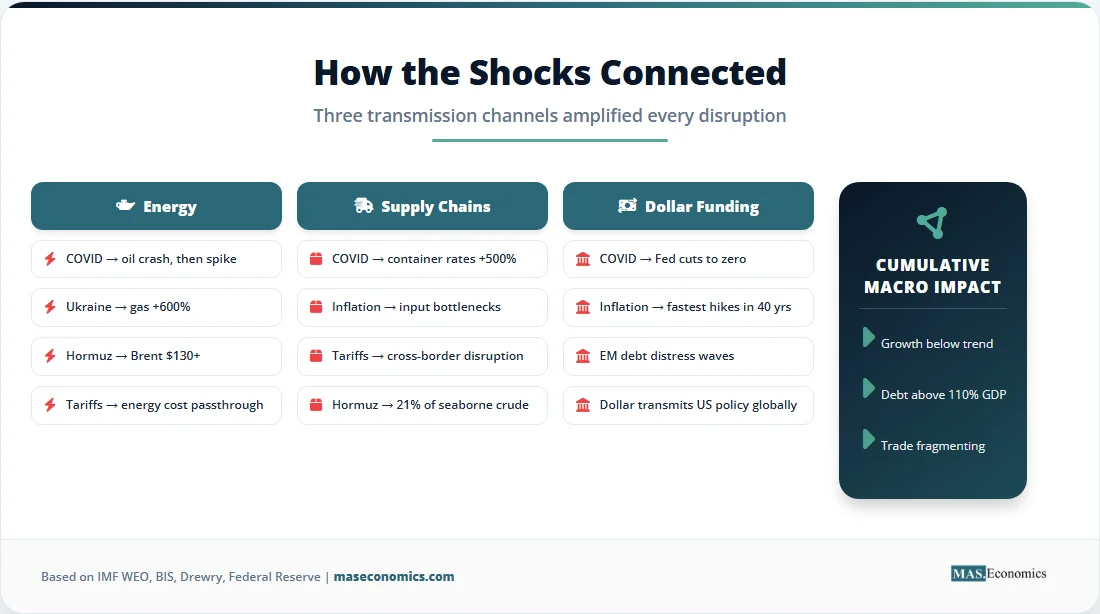
Three Transmission Channels Explained
Each shock looked unique on the surface. Underneath, three transmission channels did most of the work: energy markets, supply chains, and the dollar funding system. The same channels carried very different shocks. That is why the cumulative damage exceeded the simple sum of the events.
Energy was the most reliable amplifier. The pandemic crashed oil prices to negative prices in April 2020. The 2021 reopening sent it back above $80. The Russia-Ukraine war pushed Brent above $120 and detonated a structural gas crisis in Europe. The 2026 Hormuz episode showed that even an eleven-day disruption could move global headline inflation expectations measurably. The pattern is consistent with our analysis of why oil price shocks keep recurring: the global system remains energy-intensive, energy supply is geographically concentrated, and substitution is slow.
Supply chains were the second amplifier. The pandemic exposed how thin the just-in-time inventory model had become. By late 2021, the Drewry World Container Index was up more than 500% from its pre-pandemic level. The 2025 tariff war then targeted exactly the cross-border flows that had recovered. The economic logic of how firms responded, including nearshoring, reshoring, and friendshoring, became a strategic priority for governments as well as boardrooms. The point is not that supply chains failed. The point is that they kept being asked to absorb shocks they were not designed for.
The third channel was the dollar. Roughly 60% of global trade invoices, 50% of cross-border lending, and 88% of foreign exchange transactions involve the US dollar, according to BIS data. When the Federal Reserve hiked from 0.25% to 5.50% between March 2022 and July 2023, dollar funding tightened globally. Emerging market currencies sold off, dollar-denominated debt service costs rose, and several frontier economies, including Sri Lanka, Ghana, and Zambia, moved into sovereign debt distress. The dollar transmits US monetary policy to economies that did not vote for it, and serial shocks make that transmission louder.
The Paradox of Resilience
The strange feature of the five-shock decade is what did not happen. There was no synchronized global recession. The 2020 contraction was sharp but short. The 2022 European recession was shallow. The US avoided recession in 2023 despite the steepest yield-curve inversion since 1981. The 2025 tariff shock dented growth without producing a downturn. According to the IMF’s October 2025 forecasts, global growth has averaged roughly 3.1% over the 2021–2025 period, below the 3.7% of the 2010s but well above recession.
That looks like resilience. In some ways, it is. Faster vaccine deployment, swap lines between major central banks, larger fiscal automatic stabilizers, and better corporate inventory management all helped absorb shocks that would have caused more serious damage in earlier decades. The repeated stress tests of central bank balance sheets, including quantitative easing and emergency lending, worked as backstops.
The paradox is that resilience was bought, not earned. Each shock was absorbed by drawing down a buffer that took decades to build. Public debt in advanced economies rose from 75% of GDP in 2019 to over 110% in 2026, according to IMF Fiscal Monitor data. Central bank balance sheets ballooned and have only partly normalized. Private sector trust in the price stability mandate of central banks took its biggest hit since the 1970s. The full picture of sovereign debt sustainability is now a binding constraint on the next round of policy responses.
The shocks did not break the system. They consumed its slack.
Five Indicators Over Five Years
The chart below tracks the four indicators that capture the serial-shock era: global real GDP growth, OECD headline inflation, the Federal Reserve policy rate, and a geopolitical risk index normalized to 100 in 2019. Each shock leaves a fingerprint, but the cumulative picture matters more than any single peak.
Figure 1. Annual indicators 2019–2026. Sources: IMF WEO October 2025, OECD, Federal Reserve, Caldara & Iacoviello GPR Index. 2026 values are estimates.
Policy Lessons from Serial Shocks
Five rounds of crisis response have changed the policy toolkit. The most visible shift is the rehabilitation of supply-side intervention. Governments that spent forty years dismantling industrial policy are now actively building it. The US CHIPS and Science Act, the EU Chips Act, Japan’s domestic semiconductor subsidies, and India’s production-linked incentive schemes are all responses to the same lesson: critical supply chains cannot be left to private optimization alone. Our coverage of the revival of industrial policy traces this turn in detail.
The second lesson is about strategic stockpiles and dual sourcing. Strategic petroleum reserves, medical supply stockpiles, semiconductor inventory mandates, and rare-earth diversification programs have all expanded since 2020. The OECD’s 2025 Strategic Resilience Indicators show that advanced economies have, on average, doubled their strategic reserve coverage of critical inputs since 2019. The cost is real. So is the insurance.
The third lesson is about the inflation framework itself. The 2020 Federal Reserve framework review introduced flexible average inflation targeting just before the largest inflation surge in forty years. The Fed’s 2025 framework review walked much of that back, and the ECB’s 2025 strategy review explicitly raised the weight on supply-side risk. The ongoing central bank divergence across the Fed, ECB, BoJ, and BoE shows that there is no single optimal response to a serial-shock regime.
The fourth lesson is harder to operationalize. International coordination has weakened. The G20’s effective response to COVID-19 in 2020 contrasted sharply with the fragmented response to the 2022 energy crisis and the open hostility of the 2025 tariff war. Sanctions, export controls, and investment screening have replaced market access negotiations as the central instruments of economic statecraft. The mechanics of modern economic sanctions show why this shift matters.
Structural Changes That Will Last
Some changes are not cyclical. They are structural. The first is the partial fragmentation of global trade into geopolitical blocs. IMF research published in the October 2025 WEO shows that bilateral trade between geopolitically aligned economies has held up, while trade between rival blocs has fallen meaningfully since 2022. This is not full deglobalization. The data on whether deglobalization is actually happening is more ambiguous than the rhetoric suggests. But the geography of trade has changed, and that change shows no sign of reversing.
The second structural change is the equilibrium real interest rate. Through the 2010s, the consensus estimate of r-star was negative or barely positive. By 2025, Federal Reserve and ECB staff estimates had moved up by roughly 75 to 100 basis points. The reasons include higher public debt, higher defense spending, the green transition’s capital intensity, and weaker savings from aging societies. A higher r-star means tighter financial conditions for any given policy stance, which means less fiscal space to absorb the next shock.
The third structural change is the role of the state. Public spending as a share of GDP rose across advanced economies during COVID-19 and has not fully retreated. Defense budgets are being raised in Europe and Asia. Climate-related public investment is growing. The economics of climate adaptation alone imply sustained public spending of 1–2% of GDP per year in vulnerable economies through the 2030s. The era of state retreat that began around 1980 has ended.
The fourth change is institutional. The rules-based international economic order built after 1945 has not collapsed, but its key institutions, including the WTO appellate body and the IMF’s lending framework, are operating at reduced capacity. The 2008 financial crisis stressed this system. The five shocks since 2020 have tested it harder. Comparing the policy response of 2008 with 2020–2026 shows both progress and erosion. Our analysis of the 2008 financial crisis highlights what worked then and what no longer does.
Limits of the Resilience Framework
Resilience is a useful frame, but it has limits. The first limit is measurement. There is no single index that captures resilience. Output gaps, debt ratios, inflation expectations, central bank reserves, and supply chain redundancy all matter, and they often move in different directions. The OECD, IMF, and BIS each maintain different resilience dashboards with different conclusions. Calling an economy resilient often depends on which indicator gets weighted most.
The second limit is the polycrisis problem. The five shocks did not arrive cleanly sequenced. They overlapped. The inflation surge ran into the energy crisis. The tariff war ran into the Hormuz closure. Adam Tooze’s framing of the polycrisis, where multiple distinct shocks interact and amplify each other, suggests that resilience to any single shock may not generalize to combinations. The literature on this is still young, and the empirical evidence is mixed.
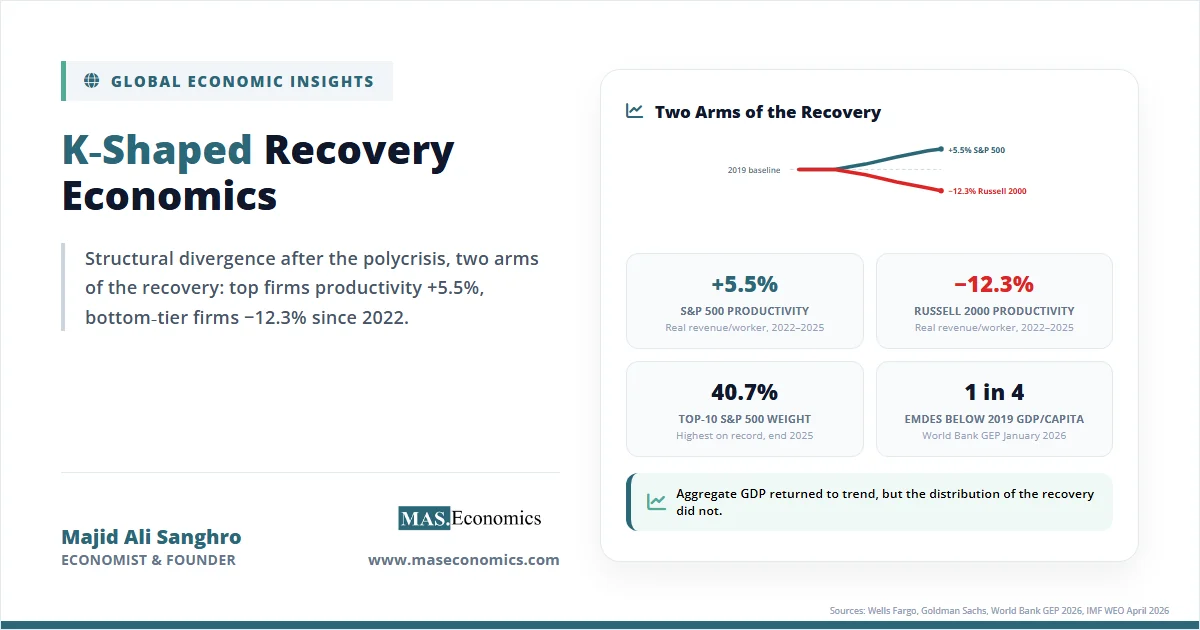
The third limit is distribution. Aggregate resilience hides distributional damage. Real wages in many advanced economies are still below 2019 levels in 2026. Lower-income households spent a much larger share of their income on the goods that inflated the most. The recovery has been visibly uneven across sectors, regions, and income groups. A K-shaped pattern, in which top earners and asset owners pulled ahead while middle and lower earners fell behind, is a feature, not a bug, of how the shocks were absorbed.
The fourth limit is the policy paradox embedded in resilience itself. Building redundancy is expensive. Strategic reserves cost money. Dual sourcing reduces efficiency. Higher capital ratios reduce credit availability. The cost of resilience is paid in lower trend productivity. Whether that trade-off is worth it depends on how often the next shock arrives.
MASEconomics Explains
4 economic concepts behind global economic resilience
Conclusion
Global economic resilience has held through five major shocks in five years, but the cost is now visible. Public debt is higher. Central bank credibility was tested. Supply chains have been re-engineered for redundancy rather than efficiency. Trade has fragmented into blocs. The state has reclaimed a larger role in economic management. Each of these changes was a rational response to a specific shock, and each has reduced the slack available for the next one.
The serial-shock decade has produced a clear empirical lesson. The global system can absorb significant disruption without collapse, provided buffers exist. Buffers require time, surplus, and political consensus to rebuild. The arithmetic of the next ten years is whether buffers can be replenished faster than new shocks arrive.
Did you find this article helpful? Share it with someone who loves economics. And remember, at MASEconomics, we make complex ideas simple.