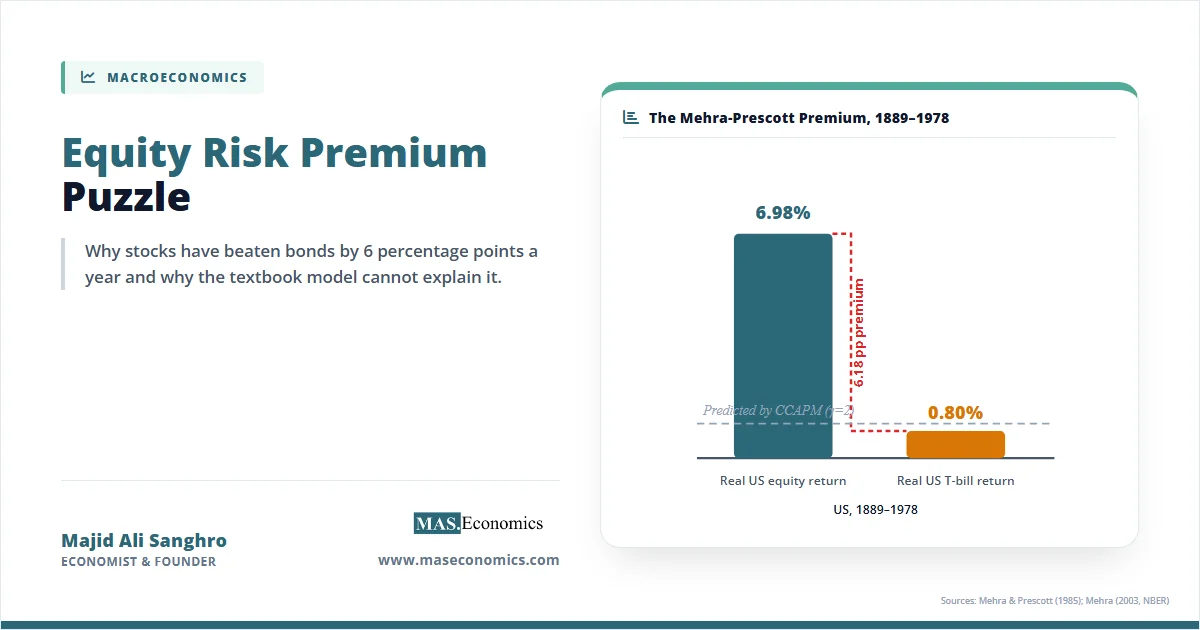
From 1889 to 1978 in the United States, the average real return on equities was 6.98 percent per year, while the average real return on Treasury bills was 0.80 percent per year, yielding a premium of 6.18 percentage points. This empirical regularity is the Equity Risk Premium Puzzle, a discrepancy between observed historical market returns and the predictions of standard economic theory that has persisted for over a century. Under the canonical consumption-based capital asset pricing model, rational consumers with reasonable levels of risk aversion should require an equity premium of less than one percent to hold risky stocks instead of risk-free bonds. Reconciling the model with the historical data demands a coefficient of relative risk aversion exceeding thirty, an extreme value that implies a consumer would reject a fifty-fifty gamble between doubling and halving their lifetime wealth. The gap between theoretical prediction and empirical reality constitutes one of the most significant anomalies in financial economics, prompting four decades of theoretical innovation.
What the Equity Risk Premium Puzzle Means
Rajnish Mehra and Edward Prescott formally introduced the anomaly in their 1985 paper, documenting that the historical US equity premium was far too large to be explained by fluctuations in aggregate consumption. Standard asset pricing theory dictates that the premium investors demand for holding risky assets should equal the covariance between asset returns and the marginal utility of consumption. Because aggregate consumption in the United States is remarkably smooth, growing at roughly one percent per year with low volatility, the covariance between stock returns and consumption growth is small. A small covariance implies that stocks are not very effective at hedging consumption risk, so the theoretical premium investors should demand is correspondingly small.
When Mehra and Prescott calibrated the consumption-based model to US data using a coefficient of relative risk aversion between one and ten, the model generated an equity premium of roughly 0.4 percent at the upper bound. The observed premium of 6.18 percent was an order of magnitude larger. To force the model to match the data, the coefficient of relative risk aversion had to be raised above thirty, and in some calibrations, above forty. Such extreme risk aversion contradicts evidence from experimental economics, labor supply studies, and portfolio choice data, which consistently place the coefficient between one and five. A risk aversion parameter of thirty implies that an individual would prefer a certain outcome of $50,000 to a coin toss between $25,000 and $100,000, a level of caution that defies observed human behavior. In a 2003 update extending the data from 1802 to 2000, Mehra showed that the real equity return averaged approximately 7.9 percent and the premium remained firmly in the five to seven percent range across subperiods, confirming that the puzzle was not an artifact of the original 1889 to 1978 sample.
The puzzle is not merely that stocks have returned more than bonds; it is that the magnitude of the difference cannot be rationalised by the observed variability of aggregate consumption within standard expected utility frameworks. Understanding why the model fails requires examining the mathematical structure that generates the premium, the empirical evidence across global markets, the four major theoretical resolutions proposed over the past four decades, and why none has won universal acceptance.
Equity Risk Premium Puzzle in Equations
The equity premium puzzle emerges directly from the fundamental equations of consumption-based asset pricing. Deriving the puzzle requires five sequential steps, beginning with the consumer’s optimisation problem and ending with the Hansen-Jagannathan volatility bound. Each step builds on the last, and the friction that generates the puzzle becomes visible at the final calibration.
Step one establishes the consumer’s Euler equation. A representative agent maximises expected lifetime utility subject to a budget constraint, choosing how much to consume today versus how much to invest for tomorrow. For any asset, the first-order condition equates the marginal cost of investing one unit of consumption today with the expected marginal benefit of the payoff tomorrow:
Here, \(\beta\) is the subjective discount factor capturing impatience, \(u'(c_t)\) is the marginal utility of consumption at time \(t\), and \(R_{t+1}\) is the gross return on the asset. The ratio of marginal utilities captures how the investor values additional consumption in the future relative to today. If consumption is expected to be high tomorrow, marginal utility will be low, and future payoffs will be valued less. The Euler equation essentially states that the expected discounted return on any asset, weighted by the consumer’s marginal utility of consumption, must equal the opportunity cost of the deferred consumption, which is standardised at one.
Step two introduces the constant relative risk aversion (CRRA) utility specification, the standard functional form in macro-finance, and the workhorse of the permanent income and consumption smoothing literature:
The parameter \(\gamma\) is the coefficient of relative risk aversion, measuring how rapidly marginal utility declines as consumption rises. It also governs the elasticity of intertemporal substitution under this specification, a dual role that becomes a point of contention in later resolutions. A \(\gamma\) of zero implies risk neutrality, while higher values imply greater sensitivity to consumption fluctuations.
Step three derives the stochastic discount factor (SDF). Under the CRRA utility, the ratio of marginal utilities simplifies to a function of consumption growth:
The SDF prices all assets in the economy: the expected product of the SDF and any asset return equals one. Because the SDF depends on consumption growth raised to the negative power \(\gamma\), higher risk aversion amplifies the sensitivity of the SDF to consumption fluctuations. The SDF acts as the price of risk: assets that pay off when marginal utility is high (when consumption is low) are valuable and command lower expected returns, whereas assets that pay off when marginal utility is low must offer higher expected returns to entice investors.
Step four extracts the equity premium using a log-normal approximation. Subtracting the risk-free rate Euler equation from the risky asset Euler equation and applying a second-order Taylor expansion yields:
The left side is the expected excess return plus a Jensen’s inequality correction for the variance of the log return. The right side shows that the premium equals risk aversion multiplied by the covariance between consumption growth and equity returns. This covariance is the engine of the premium in the consumption-based framework. If stocks tend to pay off when consumption is already high (low marginal utility), investors demand a high premium to hold them.
Step five applies the Hansen-Jagannathan bound, which provides a model-free restriction on the volatility of any valid stochastic discount factor:
The Sharpe ratio of the market portfolio sets a lower bound on the volatility of the SDF divided by its mean. Because the historical US Sharpe ratio is approximately 0.30 to 0.40, the SDF must be highly volatile. Yet under CRRA utility with reasonable parameters, consumption growth is too smooth to generate sufficient SDF volatility. The standard model is constrained by the empirical reality of smooth consumption paths.
The calibration makes the failure explicit. Historical US consumption volatility \(\sigma(\Delta \log c)\) is approximately one percent per year. The correlation between consumption growth and equity returns is roughly 0.4. Equity return volatility \(\sigma(r^e)\) is approximately 16 percent. The covariance term equals the correlation multiplied by the two standard deviations: \(\text{Cov}(\Delta \log c, r^e) \approx 0.4 \times 0.01 \times 0.16 = 0.00064\). Substituting this into the equity premium expression, to generate a six percent premium: \(0.06 \approx \gamma \times 0.00064\), which gives \(\gamma \approx 94\). Even accounting for the log-normal correction, generating the observed premium requires a coefficient of relative risk aversion well above thirty, far outside the range that microeconomic evidence supports. The math is unambiguous: either risk aversion is absurdly high, or the standard model is missing a fundamental feature of economic reality.
Table 1. Key Variables in the Equity Premium Puzzle
| Variable | Symbol | Calibration | Description |
|---|---|---|---|
| Risk Aversion | \(\gamma\) | 1–5 (reasonable), >30 (puzzle) | Coefficient of relative risk aversion |
| Consumption Volatility | \(\sigma(\Delta \log c)\) | ~1.0% | Annual standard deviation of real consumption growth |
| Equity Volatility | \(\sigma(r^e)\) | ~16.0% | Annual standard deviation of real equity returns |
| Return-Consumption Correlation | \(\rho\) | ~0.4 | Correlation between equity returns and consumption growth |
| Observed Premium | \(E[r^e – r^f]\) | ~6.0% | Historical US equity premium over Treasury bills |
| Discount Factor | \(\beta\) | ~0.99 | Subjective time preference parameter |

|
|||
Key Assumptions and Limitations
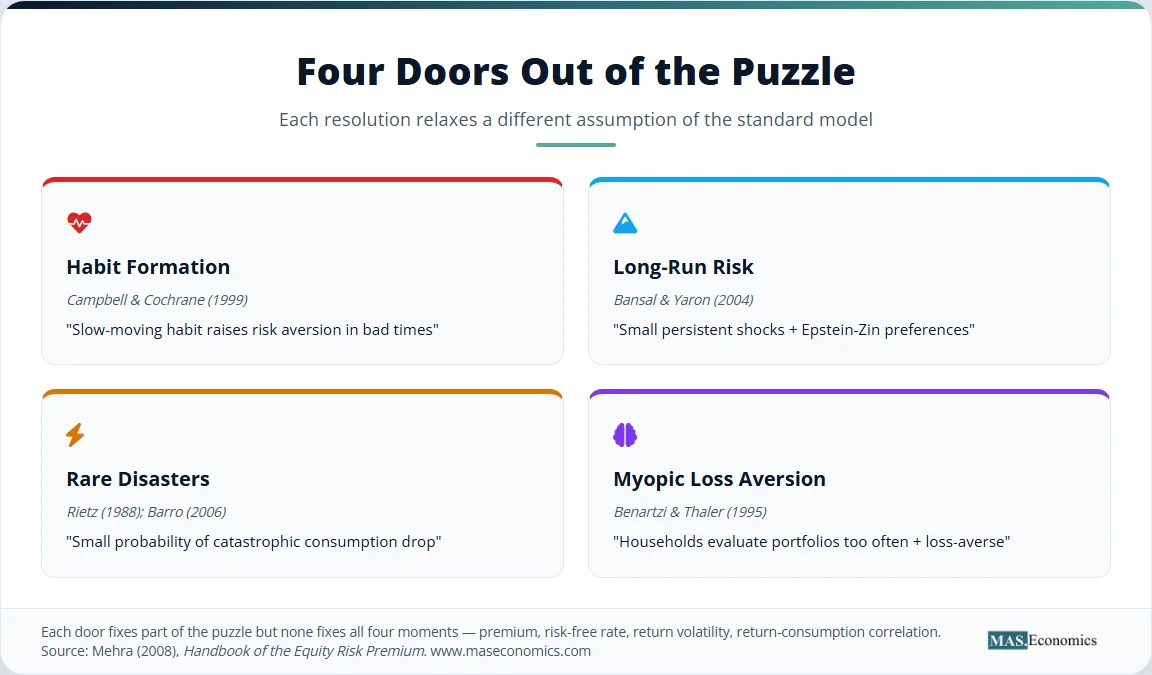
The standard consumption-based model relies on four restrictive assumptions. Relaxing each assumption constitutes one of the four major theoretical resolutions to the puzzle, and each resolution succeeds partially while failing to explain all the moments of the data simultaneously. The structure of these limitations foreshadows the broader economic implications discussed later.
The first assumption is time-separable utility, where lifetime utility is the discounted sum of current and future consumption: \(U = \sum_t \beta^t u(c_t)\). Under this structure, the marginal utility of consumption today depends only on today’s consumption level, not on past consumption history. Campbell and Cochrane (1999) relaxed this by introducing habit formation, where utility depends on consumption relative to a slow-moving habit level determined by past consumption. When consumption falls toward the habit, effective risk aversion spikes dramatically, amplifying the SDF volatility without requiring a high baseline \(\gamma\). Habit formation successfully explains the counter-cyclical variation in the equity premium, as risk aversion rises precisely when the market falls. However, it requires an implausibly persistent habit process to match the long-run data, and the mechanism introduces a joint-hypothesis problem in distinguishing whether changing premiums reflect changing risk or changing risk aversion.
The second assumption is that consumption growth follows an i.i.d. process with constant mean and variance. This implies that consumption shocks have no persistent effects and that the long-run outlook is always the same. Bansal and Yaron (2004) relaxed this by proposing a long-run risk model, where a small but highly persistent component drives consumption growth, and investors have Epstein-Zin preferences that separate risk aversion from the elasticity of intertemporal substitution. The persistent component makes equities much riskier because shocks to long-run growth have large compounding effects on wealth. Long-run risk can generate a large premium with moderate \(\gamma\), but it requires investors to have a strong preference for early resolution of uncertainty, a parameter restriction that remains empirically controversial and difficult to validate.
The third assumption is that the sample period is free of economic disasters. The standard model evaluates risk based on observed consumption volatility, but if the true distribution of consumption includes rare but catastrophic drops, the observed sample may understate the true risk. Rietz (1988) and Barro (2006) relaxed this by incorporating rare disasters into the consumption process. If there is a small probability of a catastrophic consumption drop, such as a depression, war, or revolution, equities bear disaster risk and demand a premium for bearing it. Because disasters are rare, they may not appear in a century of data, yet they exert a large effect on expected returns. Rare disaster models explain the level of the premium with \(\gamma\) around four, but they struggle to explain the high volatility of equity returns observed during normal times, and identifying these disasters in real time remains a significant empirical challenge.
The fourth assumption is expected utility maximisation. Standard theory assumes that agents evaluate risky prospects solely based on the statistical expectation of a concave utility function. Benartzi and Thaler (1995) relaxed this by incorporating prospect theory, specifically loss aversion and myopic evaluation. If investors evaluate their portfolios frequently and feel losses more acutely than gains, the perceived risk of equities is much higher than the consumption-based model suggests. Myopic loss aversion explains why households under-invest in equities, but it operates as a behavioural friction rather than a rational equilibrium mechanism and cannot be derived from a representative agent framework, limiting its usefulness for pricing aggregate market indices.
Table 2. Major Resolutions to the Equity Premium Puzzle
| Resolution | Lead Authors (Year) | Mechanism | What It Explains | What It Misses |
|---|---|---|---|---|
| Habit Formation | Campbell & Cochrane (1999) | Slow-moving habit raises effective risk aversion in bad times | Time variation in premium; counter-cyclical Sharpe ratio | Requires implausibly persistent habit |
| Long-Run Risk | Bansal & Yaron (2004) | Small persistent component in consumption growth + Epstein-Zin preferences | Premium magnitude with reasonable \(\gamma\) | Requires preference for early resolution of uncertainty |
| Rare Disasters | Rietz (1988); Barro (2006) | Small probability of catastrophic consumption drop (war, depression) | Premium level with \(\gamma \approx 4\) | Hard to identify disasters in real time |
| Myopic Loss Aversion | Benartzi & Thaler (1995) | Investors evaluate portfolios too often + loss aversion | Why households under-invest in equities | Not derivable from rational equilibrium |
|
|
||||
Global Evidence for the Equity Premium Puzzle
The empirical foundation of the puzzle rests on multiple datasets spanning different countries and centuries. The original Mehra and Prescott (1985) sample established the baseline for the United States from 1889 to 1978. Over this period, the average real return on equities was 6.98 percent per year, the average real return on Treasury bills was 0.80 percent per year, and the equity premium was 6.18 percentage points. Consumption growth over the same period averaged 1.83 percent per year with a standard deviation of roughly 3.57 percent. The combination of a large premium and smooth consumption created the central tension. Furthermore, the data exposed a twin puzzle: if risk aversion is high enough to explain the equity premium, the same consumers should be so desperate to smooth consumption that they bid the risk-free rate well below zero, yet the real risk-free rate was slightly positive. The standard model cannot simultaneously generate a high equity premium and a low but positive risk-free rate.
Mehra updated the analysis in a 2003 National Bureau of Economic Research working paper, extending the US sample back to 1802 and forward to 2000. The extended data confirmed that the premium was not a statistical aberration of the original ninety-year window. Real equity returns averaged approximately 7.9 percent per year from 1802 to 2000, and the premium remained firmly in the five to seven percent range across subperiods, including the volatile interwar period and the post-war boom. The risk-free rate remained consistently below two percent in real terms. The persistence of the premium across vastly different economic environments, including the gold standard, the Great Depression, and the Bretton Woods system, strengthened the conclusion that the puzzle reflects a deep structural feature of market economies rather than a historical anomaly.
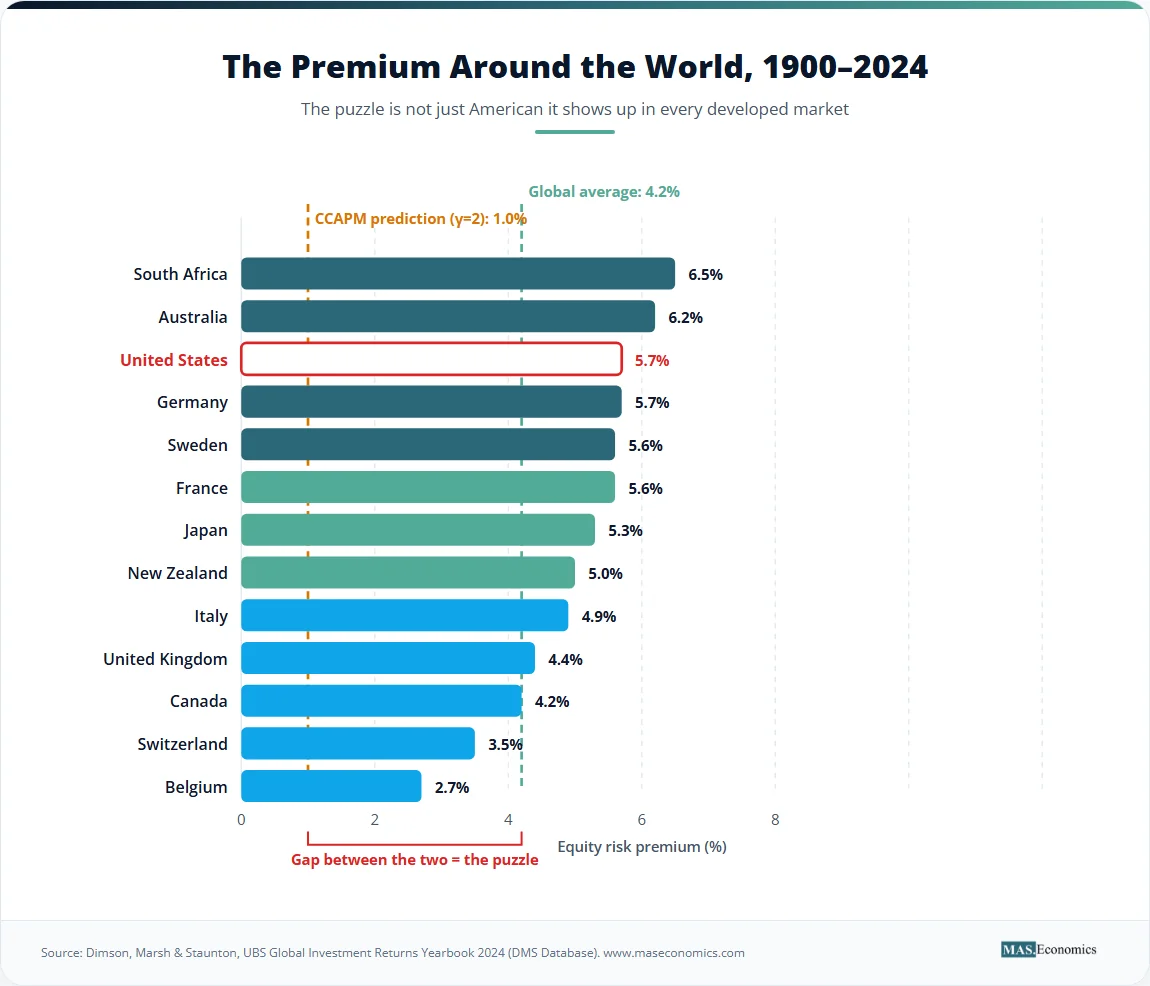
The puzzle extends beyond the United States. Dimson, Marsh, and Staunton, in their UBS Global Investment Returns Yearbook 2024/2025, compiled data for twenty-one countries from 1900 to 2024. The global equity premium versus bills averaged 4.2 percent per year, and the premium versus bonds averaged 3.0 percent. Some countries, including Australia, the United States, and Sweden, exhibited premiums above five percent. Others, including Belgium, Italy, and Germany, exhibited lower but still positive premiums. The German and Italian markets experienced severe disruptions during the twentieth century, including hyperinflation and expropriation, which depressed long-run real returns. The cross-country evidence rules out the hypothesis that the puzzle is a US-specific artifact driven by survivorship bias, although the US premium is at the upper end of the global distribution. The fact that every developed market with intact historical records shows a substantial premium suggests that the phenomenon is systemic.
Jordà, Knoll, Kuvshinov, Schularick, and Taylor (2019) expanded the evidence further in their Quarterly Journal of Economics paper covering sixteen advanced economies from 1870 to 2015. They documented that the equity premium averaged five to seven percent across countries, confirming the global nature of the phenomenon. Their data also revealed that bond returns have risen modestly in recent decades, slightly narrowing the premium, but the gap remains far too large for the standard model to rationalise. Crucially, they found that housing returns have rivaled equity returns over the long run, a finding that deepens the puzzle because housing is less liquid and less diversified than equities, yet commands a similarly high premium. Campbell (2003) provides a comprehensive synthesis of the consumption-based pricing literature in the Handbook of the Economics of Finance, establishing the puzzle as the central anomaly that every subsequent asset pricing model must address.
How the Equity Premium Puzzle Shapes Policy
The equity premium puzzle anchored modern asset pricing as a distinct sub-discipline of financial economics. Before Mehra and Prescott, the consumption-based model was treated as a theoretical curiosity with limited empirical relevance. After 1985, every consumption-based asset pricing chapter in graduate textbooks existed to address the puzzle. The field crystallised around the effort to reconcile the model with the data, spawning habit formation, long-run risk, rare disasters, and behavioural finance as distinct research programmes. The puzzle functioned as the anomaly that organised an entire discipline, setting the research agenda for a generation of financial economists.
Pension policy turns directly on whether the historical equity premium is real and persistent. If the premium reflects a genuine risk compensation that will continue into the future, defined-contribution pension plans should hold substantially more equities than they do, because the long-run payoff dominates the short-run volatility. If the premium instead reflects a historical accident or survivorship bias, aggressive equity allocation exposes retirees to catastrophic risk without adequate compensation. The 2006 US Pension Protection Act, which made target-date funds with substantial equity exposure the default option in 401(k) plans, implicitly sided with the behavioural resolution: households under-invest in equities because of myopic loss aversion, and default nudges correct this bias. The default allocation to equities in target-date funds for young workers frequently exceeds eighty percent, an allocation justified only if the equity premium is both real and substantial.
Sovereign wealth funds invoke the puzzle explicitly in their allocation strategies. Norway’s Government Pension Fund Global, the world’s largest sovereign wealth fund managing over $1.5 trillion, increased its equity allocation from 60 percent to 70 percent in 2017. The Ministry of Finance explicitly referenced the historical equity premium and the long-term nature of the fund’s liabilities in justifying the shift, acknowledging that the premium exceeds what standard models predict but treating the empirical evidence as practically relevant. The fund’s infinite horizon allows it to absorb short-run drawdowns, and the Norwegian government calculated that the expected return improvement from the additional equity exposure would significantly increase fiscal space over decades. The Canada Pension Plan Investment Board uses similar reasoning, maintaining a heavily equity-weighted portfolio on the grounds that the long-run premium compensates for interim volatility.
Social Security debates in the United States and Canada have repeatedly turned on the reliability of the equity premium. Proposals to allow trust-fund investment in equities argue that the historical premium provides a free lunch: the trust fund can capture higher returns without increasing contributions or cutting benefits. Opponents counter that the US experience may reflect survivorship bias, since the United States avoided the catastrophic disruptions that destroyed equity value in other countries during the twentieth century. If the true equity premium is lower once disaster risk is properly priced, the case for trust-fund equity investment weakens considerably. Furthermore, allowing the government to hold large equity positions raises corporate governance concerns, as the state would become a dominant shareholder in major corporations. The theoretical resolution to the puzzle directly determines the policy conclusion.
Behavioural nudges in retirement accounts trace their academic lineage to the Benartzi-Thaler resolution. If households evaluate their portfolios too frequently and weigh losses more heavily than gains, they will perceive equities as riskier than they truly are over long horizons and under-invest accordingly. This insight provides the theoretical foundation for auto-enrolment with default equity allocation, a policy now adopted in the United Kingdom, the United States, New Zealand, and several other jurisdictions. The loss aversion mechanism explains observed household behaviour more convincingly than rational models, even if it does not provide a full equilibrium account of market prices. Thaler’s subsequent influence on pension policy design, including the Save More Tomorrow programme, demonstrates how resolving a theoretical puzzle can translate directly into legislation affecting millions of workers.
The puzzle survives because no single resolution explains all the moments simultaneously: the premium magnitude, the low risk-free rate, the high return volatility, and the low consumption-return correlation. Rare disasters explain the level, but struggle with the volatility. Long-run risk explains the volatility but requires implausibly high Epstein-Zin preference parameters. Habit formation explains the time variation but not the level. Loss aversion explains pension behaviour but not asset prices in equilibrium. The puzzle has evolved from a question of whether the standard model is wrong to a question of which feature of household preferences is the right fix.
MASEconomics Explains
4 economic concepts behind the Equity Risk Premium Puzzle
Conclusion
The Equity Risk Premium Puzzle remains the most cited anomaly in financial economics because it exposes a fundamental mismatch between the predictions of standard theory and the evidence of capital markets. The six-percentage-point gap between historical US equity returns and risk-free rates cannot be reconciled with a consumption-based model that assumes time-separable CRRA utility, smooth consumption, and rational expectations without imposing extreme risk aversion that no microeconomic evidence supports. Four decades of theoretical innovation have produced resolutions that explain part of the anomaly but none that explain all of it. The puzzle has thus transformed from a narrow calibration problem into the organising principle of modern asset pricing research, driving developments in macro-finance, behavioural economics, and pension policy that continue to shape how economists understand the relationship between risk and return.
Did you find this article helpful? Share it with someone who loves economics. And remember, at MASEconomics, we make complex ideas simple.