An hour of American work in 2026 produces 107 percent more than an hour of American work in 1990. Nobody is working twice as fast, and the working day has not doubled in length. The output produced in that hour has doubled, and that single fact is the reason a household today can own things a household in 1990 could not, without anyone in it working longer. That is what is productivity in the only sense that matters: how much comes out of an hour of work.
It is the least dramatic number in economics and the one that decides the most. Wages, pensions, public services and the length of the working week are all claims on what production generates. If output per hour stops rising, those claims can only be rearranged, never enlarged, and the arguments about how to divide them get sharper every year.
The Measure, and What It Does Not Say
Labour productivity is output divided by hours worked. The United States publishes it for the nonfarm business sector, which is the version economists usually quote, and it is an index rather than a dollar amount, so what matters is how it moves.
Two clarifications prevent most misreadings. First, the measure says nothing about how hard anyone is working. Output per hour rises when a worker gets better tools, better training, better organisation or better technology, and a modern harvester does not make the driver more diligent than the person who once did the same work by hand. Second, it is measured for a whole sector or a whole economy, not for an individual, so it is not a judgement about any particular employee.
Three things push it up. Capital per worker, which is more and better equipment. Human capital, which is the skill and health of the people using it. And the residual that economists call total factor productivity, which covers everything about how the two are combined: management, logistics, competition, the law, the reliability of the electricity supply. The Solow-Swan growth model is built on exactly this decomposition, and its central result is that only the third one can raise living standards forever.
A Quarter of a Point Is the Difference Between One Generation and Two
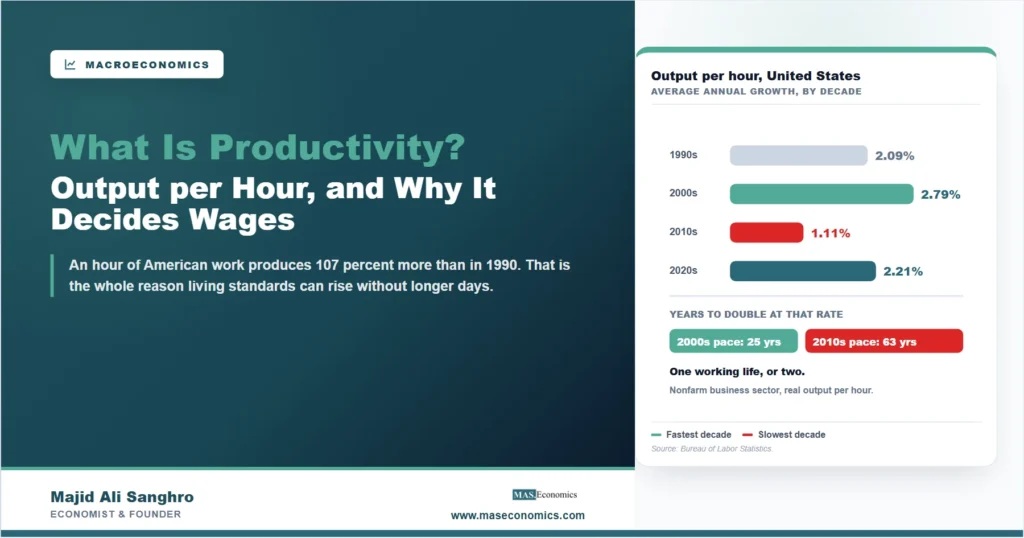
Productivity growth arrives in numbers that look too small to argue about. American output per hour grew 2.09 percent a year through the 1990s, 2.79 percent through the 2000s, 1.11 percent through the 2010s, and 2.21 percent so far in the 2020s. Those look like four similar decades. They are not.
| Period | Average annual growth | Years to double at that rate |
|---|---|---|
| 1990 to 2000 | 2.09% | 34 |
| 2000 to 2010 | 2.79% | 25 |
| 2010 to 2020 | 1.11% | 63 |
| 2020 to 2026 | 2.21% | 32 |
| 1990 to 2026, whole period | 2.03% | 35 |

|
||
Read the third column rather than the second. At the 2000s rate, an economy doubles what an hour of work produces in twenty five years, so a person entering the workforce sees it happen once before retiring, and their children start from twice the base. At the 2010s rate it takes sixty three years. The same doubling now takes two working lifetimes instead of one.
That is the whole argument about productivity in one comparison, and it explains why economists spent the 2010s worrying about a slowdown that most people never read a headline about. Nothing visible happens in a year of 1.11 percent growth. Everything happens over thirty.
Why It Sets Wages, and Why That Link Can Fail
Over long periods, real wages track output per hour, and the reason is not sentiment about fairness. A firm can pay a worker more than that worker produces only until the money runs out. It can pay less only until a competitor offers more. Across an economy and across decades, the two series move together because production is what wages are paid out of.
The link is loose in the short run and can stay loose for years. Real hourly earnings for American production workers are 5.8 percent higher than they were in June 2019, a period in which output per hour rose considerably more, so the gains did not divide evenly. How the surplus is shared depends on bargaining power, market concentration, the tax system and where the new output shows up. But the ceiling is set by production. A country that stops raising output per hour cannot raise real wages for everybody, whatever it does about the division, and the difference between real and nominal wages is where that constraint becomes visible.
Growth Without Hiring, Which Is What 2026 Looks Like
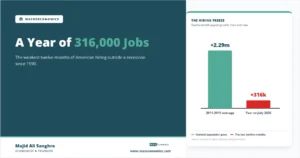
The current American data shows why the measure is worth following in real time and not only in history books. Output per hour rose 2.24 percent over the year to the second quarter of 2026, comfortably above the average of the past thirty six years. Over roughly the same period the economy added 316,000 jobs, a fraction of the 1.5 to 2 million a normal expansion adds.
Those two facts fit together, and the arithmetic is the point. If output grows while hours barely grow, output per hour must be rising. The economy is producing more without adding many people to produce it. Whether that is the beginning of a genuine technology gain, a composition effect from which jobs disappeared, or a measurement artefact that later revisions will remove is a real question, and the honest answer is that one year of data cannot settle it. What can be said is that anyone reading only the jobs number is missing half the picture. Our companion piece on the AI productivity paradox covers the technology side of the same question.
Why the American Number Is Read Everywhere
Productivity is the least local of economic statistics. A country that raises output per hour can pay higher wages at unchanged export prices, which is how a high-wage economy stays competitive without devaluing. A country that does not eventually faces the choice between wages and market share.
The American series matters abroad for a further reason. Fast American productivity growth allows fast wage growth without inflation, which allows an easier interest rate path, and that path prices borrowing everywhere the dollar reaches. When American productivity slowed in the 2010s, the debate about secular stagnation, low interest rates and weak investment followed it into every advanced economy. The number is measured in one country and read in all of them.
MASEconomics Explains
3 economic concepts behind productivity
These concepts are explored in depth across our educational articles library.
Conclusion
What is productivity comes down to a single ratio, output divided by hours worked, and to one consequence. It is the only way an economy can give people more without asking them for more time. American output per hour has more than doubled since 1990, which is why a working week of the same length buys a different life than it did then.
The number to watch is the growth rate, and the way to read it is through the doubling time rather than the decimal. Two and three quarters percent a year doubles output per hour within a working life. One and a tenth percent takes two. Nothing about that difference is visible in any single year, which is exactly why it is worth measuring carefully and reading patiently. Wages, pensions and public services are all paid out of what those hours produce, and every argument about how to divide the total is bounded by how fast the total is growing.
Frequently Asked Questions
What is productivity in simple terms?
It is how much output comes from an hour of work. If a bakery makes 100 loaves in an eight hour day, productivity is 12.5 loaves per hour, and it rises if a better oven, a better layout or a better trained baker produces 15 loaves in the same eight hours. Across a whole economy the same idea is measured as an index of output per hour worked.
Does higher productivity mean people are working harder?
No. It usually means they are working with better equipment, better skills or better organisation. A farmer with a combine harvester is enormously more productive than one with a scythe, and that has nothing to do with effort. This is why productivity statistics should never be read as a judgement about workers.
Why does productivity growth matter so much for living standards?
Because it sets the ceiling on what can be paid out. Real wages, pensions and public services are claims on what production generates, so they can rise together only when production per hour rises. Without it, one group’s gain has to come from another’s loss, which is why distribution arguments sharpen when productivity growth is weak.
How fast is American productivity growing now?
Output per hour in the nonfarm business sector rose 2.24 percent over the year to the second quarter of 2026, above the 2.03 percent average since 1990 and well above the 1.11 percent of the 2010s. One year is not a trend, and this one coincides with unusually weak hiring, so it is better read as a question than as a conclusion.
What is the difference between labour productivity and total factor productivity?
Labour productivity is output per hour worked, and it can rise simply because each worker has more machinery. Total factor productivity is what remains after accounting for both labour and capital, so it measures how efficiently the two are combined. Capital deepening runs into diminishing returns; total factor productivity does not, which is why growth theory treats it as the long-run driver.
Can an economy grow without productivity growth?
Yes, by adding workers or hours, through population growth, immigration or higher participation. That raises total output but not output per person, so it does not by itself raise living standards. It also cannot continue indefinitely, since hours are finite, which is why productivity is the part that matters over decades.
Thanks for reading! The next time a productivity figure looks too small to matter, work out how long it would take to double at that rate, and the stakes become obvious. Happy learning with MASEconomics