Three statements about the American economy are simultaneously true in August 2026. The unemployment rate is 4.1 percent, a figure most economists would have called full employment in any previous decade. Initial jobless claims ran at 199,000 in the week to August 1, close to the lowest layoff rates ever recorded relative to the size of the workforce. And the US labor market added 316,000 jobs in the twelve months to July, about a seventh of the pace that was normal through the 2010s, with outright job losses in two of the last six months.
Any one of these numbers, quoted alone, paints a false picture. Quoted together they describe something the standard vocabulary handles badly: a labor market that is neither healthy nor collapsing, but frozen. Nobody is being fired, and almost nobody is being hired. This article walks through the arithmetic of how all three facts fit together, and what a frozen market means for the people standing on either side of its wall.
A Year of Hiring, Added Up
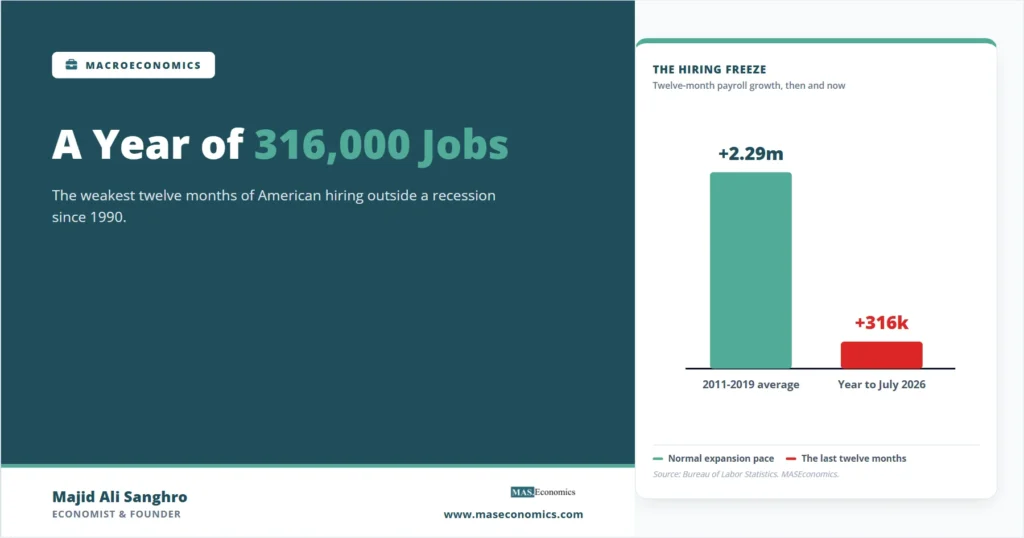
Total nonfarm payrolls stood at 158.9 million in July 2026, against 158.5 million a year earlier. The twelve-month gain of 316,000 compares with an average of about 2.29 million a year across 2011 to 2019, the last long expansion. On that yardstick, a year of normal hiring has shrunk to seven weeks’ worth.
The monthly path through 2026 shows the freeze settling in. February lost 156,000 jobs. March recovered 214,000, April added 148,000, and then the sequence faded: 63,000 in May, 20,000 in June, and a loss of 23,000 in July. The last three months together produced 60,000 jobs, in an economy that used to produce three times that many in an ordinary month. The slowdown was already visible in the spring, when the April jobs report could still be read as a soft patch. Four reports later, the soft patch is the trend.
Only Recessions Have Printed Numbers This Small
The twelve-month change in payrolls has a thirty-six-year record, and the company that a +316,000 reading keeps is worth naming precisely. Since 1990, twelve-month job growth at or below the current figure has occurred in exactly two other episodes: the months during and after the 2008 to 2009 financial crisis, through 2010, and the pandemic collapse of 2020 and 2021. Every earlier stretch this weak either sat inside a recession or in its immediate aftermath. The present reading is the first in the series to occur with no recession declared, no spike in layoffs, and an unemployment rate close to what most economists consider full employment.
What makes the current episode unlike its two predecessors is the layoff side. In 2009 and 2020, weak hiring arrived together with mass dismissal, and everyone could see the recession around them. This time the dismissals never came, which is why the freeze can persist without tripping any of the alarms that usually force a response.
The Freeze: Low Firing, Lower Hiring
Initial jobless claims are the sharpest weekly measure of firing, and they show nothing resembling distress. The week to August 1 recorded 199,000 new claims, and the four-week average sits just below 199,000. In an employed workforce of nearly 159 million, that is an extraordinarily low rate of involuntary separation. Employers are holding the workers they have, a behavior often attributed to the memory of 2021 and 2022, when firms that had shed staff spent two years and considerable money trying to rehire them.
A market with low firing and low hiring divides the population into insiders and outsiders. For the employed, the freeze is almost invisible: their jobs are safe, and the layoff risk that defines a recession has not materialized. For anyone outside trying to get in, the picture inverts. New graduates, parents returning after raising children, and the recently displaced all face a market generating a seventh of its usual openings from growth. This is the same asymmetry documented when AI displacement began showing up in the data: the burden landed on people entering the market rather than people already in it, which keeps the damage out of the headline unemployment rate. A frozen door does not show up in statistics about the people already inside the room.
Why 4.1 Percent Is Not a Contradiction
The instinctive objection is that an unemployment rate of 4.1 percent cannot coexist with hiring this weak. It can, for two reasons, and the arithmetic matters more than the intuition.
First, the unemployment rate and the payroll count do not come from the same survey. The payroll figure counts jobs, reported by employers; the unemployment rate comes from a survey of households, and it counts people who are actively looking for work as a share of those working or looking. The two measures routinely tell different stories over short horizons, and the household concepts are the ones a frozen market flatters. A rate is a stock measure: it says how many people are stuck outside right now, not how hard the door is to get through.
Second, the amount of job growth needed to hold the unemployment rate steady depends on how fast the labor force grows, and the American labor force is growing far more slowly than it did a decade ago. Labor force participation stood at 61.4 percent in July 2026, against 63.1 percent in July 2019, as an aging population pulls the share of adults in the market steadily down. When fewer new workers arrive each month, fewer new jobs are needed to absorb them. A pace of hiring that would have sent unemployment climbing in the 2010s can leave the rate flat in 2026. The rate is telling the truth about a smaller question, and our guide to what unemployment measures explains why the headline number was never designed to capture how easy work is to find.
Paychecks Against Prices
For those inside the frozen market, the squeeze arrives through a different channel. Average hourly earnings for production and nonsupervisory workers rose 3.22 percent in the year to July 2026. Consumer prices rose 3.46 percent in the year to June, the latest month published. On those two measures, offset by one month, the real hourly wage is slightly negative: pay is rising almost exactly as fast as prices, and no faster. The distinction between a raise and a real raise is the difference between the number on the payslip and what it buys, a distinction covered in detail in our guide to real versus nominal values.
Flat real pay in a market where changing jobs is hard completes the picture of why measured conditions and felt conditions have separated so widely. The unemployment rate says little is wrong. The lived experience is a job that cannot be left, pay that does not outrun the rich world’s highest inflation, and a hiring market that offers no exit. That gap between the statistics and the mood is measurable, and it is the subject of our analysis of consumer sentiment at its lowest level since 1990, recorded in an economy with, on paper, full employment.
| Measure | Latest reading | The yardstick |
|---|---|---|
| Payroll growth, 12 months to Jul 2026 | +316,000 | 2011 to 2019 average: +2.29 million |
| Payroll change, last three months | +63,000, +20,000, then -23,000 | Two losing months in the last six |
| Unemployment rate, Jul 2026 | 4.1 percent | Near most estimates of full employment |
| Initial jobless claims, week to Aug 1 | 199,000 | Historically low firing for a 159m workforce |
| Hourly earnings, 12 months to Jul 2026 | +3.22 percent | Production and nonsupervisory workers |
| Consumer prices, 12 months to Jun 2026 | +3.46 percent | Real hourly pay slightly negative |
| Labor force participation, Jul 2026 | 61.4 percent | 63.1 percent in July 2019 |

|
||
What a Frozen American Labor Market Reaches
The American labor market is not a domestic indicator. It is the input the Federal Reserve watches most closely, and the Fed’s next move is priced into every asset on earth. A jobs picture this weak strengthens the case for further rate cuts, though as we documented when the Fed’s cuts failed to reach the mortgage market, what the Fed does to its policy rate and what households and firms actually pay have become loosely connected. A frozen labor market also cools the growth of American consumer demand, and American consumer demand is the largest single market for the exports of Europe, East Asia, Mexico, and much of the developing world. When American hiring stalls, the effect arrives in Stuttgart and Seoul through order books, usually within two or three quarters.
There is also a quieter channel. Multinational employers set hiring plans globally, and the caution that froze American hiring is rarely confined to American offices. The freeze travels inside companies, without any market transaction to record it, which is one reason labor markets across the rich world have cooled together even where local conditions differ. How employment statistics are built, and why the payroll and household numbers can point in opposite directions for months, is covered in our explainer on reading jobs reports.
MASEconomics Explains
3 economic concepts behind the frozen labor market
These concepts are explored in depth across our educational articles library.
Conclusion
The US labor market of mid-2026 is best described by the numbers it is not producing. It is not producing layoffs: initial claims near 199,000 are consistent with employers gripping their existing workforces tightly. It is not producing jobs: 316,000 over twelve months is a level that, in thirty-six years of data, had previously appeared only during or immediately after the two great recessions of the era. And it is not producing rising living standards for hourly workers, whose pay growth of 3.22 percent sits just below inflation of 3.46 percent.
The unemployment rate of 4.1 percent is accurate and it is also insufficient, because a rate that counts the people locked out cannot describe how firmly the door is shut. A frozen market protects insiders and penalizes entrants, which is why it can feel calm from inside a job and hopeless from outside one, at the same time, in the same economy. The payroll series will decide which way this resolves: a thaw would show up first in the monthly gains returning to six figures, and a break would show up first in the claims data, where firing always announces itself before the unemployment rate hears the news.
Frequently Asked Questions
Why is unemployment low if job growth is so weak?
Because the labor force is growing slowly. The unemployment rate only rises when people looking for work outnumber the jobs being created, and with participation falling as the population ages, far fewer new jobs are needed to absorb new workers than a decade ago. Weak hiring and a stable rate can coexist for a long time.
How many jobs does the US economy normally add in a year?
Across 2011 to 2019, the last long expansion, nonfarm payrolls grew by about 2.3 million a year on average, roughly 190,000 a month. The 316,000 added in the twelve months to July 2026 is about a seventh of that pace.
What is a frozen labor market?
A market with unusually low firing and unusually low hiring at the same time. Layoffs stay rare, so unemployment stays low, but few new positions open, so finding work is hard for anyone outside. It protects existing workers and penalizes new entrants, the reverse of a recession, which harms both.
What is the difference between the payroll survey and the household survey?
The payroll survey asks employers how many jobs they have and produces the monthly payrolls number. The household survey asks people whether they are working or looking and produces the unemployment rate. They measure different things, are collected from different sources, and can point in different directions for months.
Are real wages in the United States rising or falling?
On the latest readings, hourly pay for production and nonsupervisory workers rose 3.22 percent in the year to July 2026 while consumer prices rose 3.46 percent in the year to June. On those measures real hourly pay is slightly negative: pay is almost keeping up with prices, but not quite.
Thanks for reading! A labor market can fail people quietly, by refusing to open its door rather than by pushing anyone through it, and only the hiring numbers ever record that kind of failure. Happy learning with MASEconomics