A firm with a fixed production budget of $100,000 faces a hard arithmetic limit: every dollar spent on machinery is a dollar unavailable for wages, and the rate at which one trades for the other is set by their prices. The isocost line captures that limit exactly, drawing every combination of capital and labor a firm can buy for a given total outlay. It is the producer’s version of a budget constraint, and it brings input prices into the analysis of production, which the isoquant alone leaves out.
The line works alongside the technology described by production functions and isoquant curves. An isoquant shows what input combinations produce a given output; an isocost line shows what input combinations a given budget can afford. Cost-minimizing input choice, the central question in the costs of production, lives at the meeting of the two, which makes the isocost line the price-side half of every producer decision.
Isocost Line Defines Affordable Input Sets
An isocost line collects every pair of capital and labor whose combined cost equals a fixed total. With labor priced at the wage rate \(w\) and capital priced at the rental rate \(r\), the total spent on a given input bundle is the wage times the quantity of labor plus the rental rate times the quantity of capital. Setting that total equal to a fixed budget \(C\) defines the line.
Isocost Equation
Every bundle on the line costs the same total, which is the property that gives the line its name. Bundles below the line cost less than the budget and leave money unspent; bundles above it cost more than the budget and cannot be afforded. The line is therefore the outer boundary of what a fixed outlay can purchase, and shifting the budget shifts the whole boundary.
Slope Equals Negative Wage-Rental Ratio
Rearranging the isocost equation to put capital on the vertical axis and labor on the horizontal axis turns it into the equation of a straight line, with an intercept set by the budget and a slope set by the price ratio.
Isocost in Slope-Intercept Form
The slope is the heart of the construction. It equals the negative of the wage-rental ratio, which is the rate at which the market lets a firm trade capital for labor at constant cost. If labor costs twice as much as capital, hiring one more unit of labor requires giving up two units of capital to stay within budget, so the line is steep. If labor is cheap relative to capital, the line is shallow. The slope reflects relative prices alone, not the budget, which is why a change in the budget moves the line without tilting it.

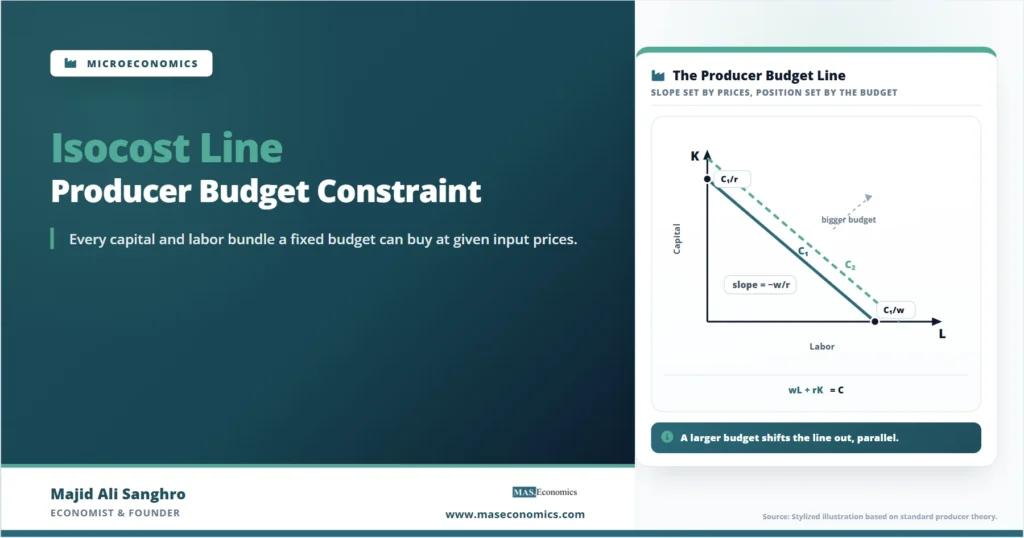
The diagram shows the two intercepts that fix the inner line. The vertical intercept at \(C_1/r\) is the amount of capital the budget buys if it is spent entirely on capital; the horizontal intercept at \(C_1/w\) is the amount of labor the budget buys if it is spent entirely on labor. The line connecting them lists every mix in between. The outer dashed line is a larger budget at the same prices: it sits parallel to the first because the slope, set only by the price ratio, has not changed.
Budget Changes Shift Line in Parallel
A change in the total cost outlay moves the isocost line without altering its slope. A larger budget pushes both intercepts outward, shifting the line away from the origin while keeping it parallel to the original, because more money buys more of both inputs at unchanged prices. A smaller budget pulls the line inward in the same parallel fashion. The distance of the line from the origin is a direct measure of how much the firm is spending.
A change in an input price behaves differently, because it alters the slope. A rise in the wage makes labor more expensive, so the budget buys less labor and the horizontal intercept moves inward while the vertical intercept stays fixed, pivoting the line to a steeper position. A rise in the rental rate pivots it the other way. Separating the parallel shifts caused by budget changes from the pivots caused by price changes is what makes the isocost line a precise instrument rather than a static picture.
| Change | Effect on the line | Reason |
|---|---|---|
| Larger total budget | Parallel shift outward | Both intercepts rise; slope unchanged |
| Smaller total budget | Parallel shift inward | Both intercepts fall; slope unchanged |
| Higher wage rate | Pivots steeper from the capital intercept | Labor intercept C/w moves inward |
| Higher rental rate | Pivots flatter from the labor intercept | Capital intercept C/r moves inward |
|
Source: MASEconomics editorial synthesis of standard producer theory.
|
||
Isocost Pairs With Isoquant for Cost Minimization
The isocost line earns its importance by combining with the isoquant. The isoquant states what the technology can produce; the isocost line states what the budget can buy. A firm minimizing the cost of a target output looks for the lowest isocost line that still touches the required isoquant, and that lowest affordable line is tangent to the isoquant at the cost-minimizing input mix.
The tangency condition. At the cost-minimizing point, the slope of the isocost line equals the slope of the isoquant. The wage-rental ratio equals the marginal rate of technical substitution, so the rate at which the market trades the inputs matches the rate at which the technology trades them.
This tangency is the bridge between the two halves of producer theory. The isoquant slope, the marginal rate of technical substitution, describes what the technology permits; the isocost slope, the wage-rental ratio, describes what the market charges. Cost minimization occurs where the two slopes agree, so the isocost line is not a standalone object but the price-side input to producer equilibrium. Without it, the isoquant map shows what is possible but never which point a cost-conscious firm selects.
Isocost Analysis Rests on Fixed Prices
The straight-line isocost rests on the assumption that input prices are constant regardless of how much the firm buys. That holds for a firm small enough to be a price taker in its input markets, but a large buyer that drives up the wage by hiring more, or secures a volume discount on capital, faces a curved cost boundary rather than a straight line. The straight isocost is the competitive benchmark, not a universal shape.
The construction also treats the budget and prices as given and asks what is affordable, without explaining where the budget comes from or how output is chosen. Those questions belong to the firm’s broader optimization over output levels and the expansion of scale. Within its scope, the isocost line does one job precisely: it translates input prices and a spending total into the exact set of input bundles a firm can buy, providing the price information that turns the isoquant map into a determinate choice.
Explains
Two ideas behind the isocost line
See how the isocost line completes the theory of production and cost.
Explore the MASEconomics BlogConclusion
The isocost line is the producer’s budget constraint, plotting every capital-and-labor bundle that costs a fixed total at given input prices. Its vertical intercept is the capital a budget buys if spent entirely on capital, its horizontal intercept is the labor it buys if spent entirely on labor, and its slope is the negative of the wage-rental ratio, the rate at which the market allows one input to be traded for another at constant cost.
The line responds to two distinct changes in two distinct ways. A change in the budget shifts it parallel to itself, because the price ratio that sets the slope is unchanged. A change in an input price pivots it, because the affordable quantity of that input alone moves. Reading those two motions correctly distinguishes a budget effect from a price effect on the firm’s input set.
Its analytical value is realized in combination with the isoquant. Cost minimization occurs at the tangency where the wage-rental ratio equals the marginal rate of technical substitution, so the isocost line supplies the price-side condition that pins down the firm’s input choice. It is the component that converts the technology map of the isoquant into a determinate, cost-minimizing decision.
Frequently Asked Questions
What is an isocost line?
An isocost line shows every combination of capital and labor that a firm can buy for a fixed total cost at given input prices. It is the producer’s budget constraint, defined by the equation that sets the wage times labor plus the rental rate times capital equal to the total outlay. Every bundle on the line costs the same total.
What does the slope of an isocost line represent?
The slope is the negative of the wage-rental ratio, the rate at which the market allows capital to be traded for labor at constant cost. If labor is twice as expensive as capital, one more unit of labor requires giving up two units of capital, producing a steep line. The slope depends on relative input prices alone, not on the budget.
How does a change in the budget affect the isocost line?
A larger budget shifts the line outward and a smaller budget shifts it inward, in both cases parallel to the original line. The slope stays the same because it is set by the price ratio, which does not change when only the budget changes. Both intercepts move by the same proportion, keeping the line parallel.
What happens to the isocost line when an input price changes?
A change in an input price pivots the line rather than shifting it. A higher wage moves the labor intercept inward and steepens the line while the capital intercept stays fixed. A higher rental rate moves the capital intercept inward and flattens the line. Price changes alter the slope, while budget changes do not.
How does the isocost line relate to cost minimization?
A firm minimizes the cost of a target output by finding the lowest isocost line that still touches the required isoquant. That line is tangent to the isoquant, and at the tangency the wage-rental ratio equals the marginal rate of technical substitution. The isocost line supplies the price information that turns the isoquant into a determinate input choice.
Thanks for reading! If you found this helpful, share it with friends and spread the knowledge. Happy learning with MASEconomics