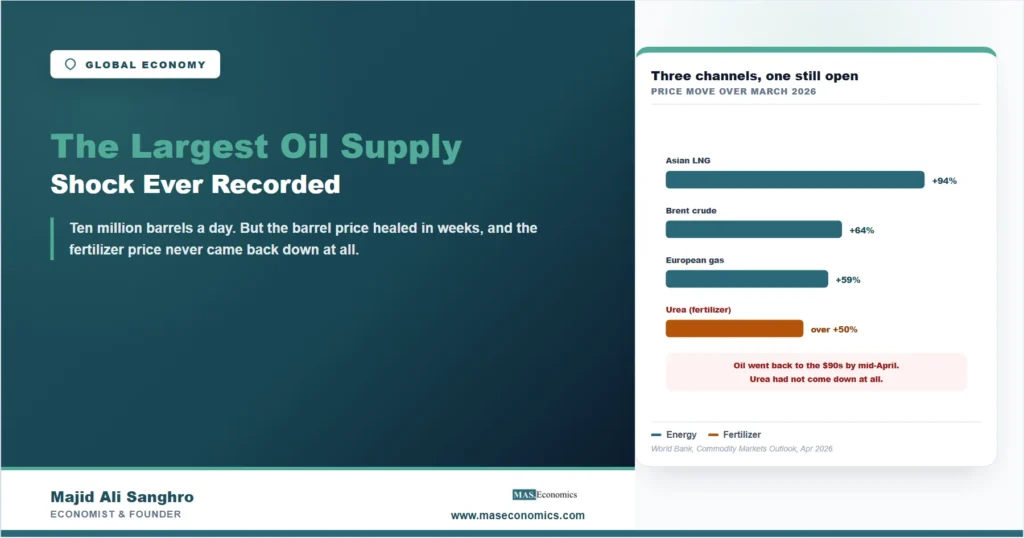
A farmer ordering urea this season is paying for a shipping lane he has never seen. The Gulf is the world’s source of the stuff, the seaborne cargoes stopped when the Strait of Hormuz effectively closed, and the price of a bag of nitrogen went up by more than half in a single month. That is the part of the oil supply shock of March 2026 that will still be doing damage next year, and it is not the part anyone reported. The headline number was the barrel: global oil supply fell by about 10 million barrels a day, which the World Bank calls the largest oil supply shock on record, and Brent went from $72 at the end of February to close March at $118, the largest monthly increase the institution has recorded. Both facts are in the April 2026 Commodity Markets Outlook, and both are worth stating precisely rather than dramatically. But the barrel price has already come most of the way back. Two other channels opened at the same time, one of them physically impossible to reroute and the other still elevated when the oil price was not, and between them they explain why this shock will be felt by people who never buy a barrel of anything.
Ten Million Barrels a Day, and Why the Record Claim Holds
Superlatives in commodity writing are usually decoration. This one is a measurement, and it is worth seeing how it was made. The Strait of Hormuz carried close to 35 percent of global seaborne trade in crude oil before the conflict, 20 percent of refined petroleum products, and 20 percent of liquefied natural gas, so the question was never whether a closure would matter but how the loss would rank against the episodes economists use as benchmarks. The answer the World Bank gives is that the roughly 10 million barrels a day lost in March 2026 was the largest disruption in history, measured against a series that includes Iraq’s invasion of Kuwait, the start of the Gulf War, the September 2001 attacks, the Venezuelan oil strike, and the Libyan civil war. The price move was ranked the same way and came out the same: $72 to $118 in a month is a rise of about 64 percent, and the institution’s own chart of the largest monthly oil price increases puts it at the top. Our guide to why energy crises keep coming back sets out the recurring pattern these episodes share, and the chokepoint itself is the subject of our piece on the forty-kilometer strait. What makes the 2026 episode different is not the size of the price move but where the pressure went afterwards, because by the first half of April Brent had moderated back into the $90s, still more than 50 percent above where it started the year but no longer at the top of the chart.
The Gas That Cannot Be Rerouted
Oil has a property that makes every oil crisis less bad than it first looks: some of it can go around. Before the conflict there was roughly 5.5 million barrels a day of spare pipeline capacity available to redirect crude that would normally transit the Strait, and about 3 million barrels a day of that was estimated to have been used in March. That is a partial escape valve, and it is a large part of why the barrel price moderated within weeks. Liquefied natural gas has no such valve. The World Bank states it plainly: there are no alternative routes for natural gas transported as LNG. A pipeline is a fixed asset that either exists between two points or does not, and no amount of price signal builds one inside a quarter, so when Gulf exports stopped the only adjustment available was competition among buyers for whatever cargoes were already at sea. That competition is what the numbers describe. The Asian LNG benchmark rose 94 percent over the course of March and European gas prices gained 59 percent, taking the Asian benchmark to nearly $18 per million British thermal units and the average European price in March to levels not seen since early 2023, the year after Russia’s invasion of Ukraine. In the first half of April gas softened across regions on hopes that negotiations would ease shipping curbs, but it stayed elevated, which is a different sentence from the one written about oil. The pass-through of this into consumer prices follows the pattern set out in our article on what the 2022 energy shock did to inflation, and it is textbook cost-push pressure rather than anything a central bank caused.
This is also where the usual direction of spillover reverses, and it is worth being explicit about it because most readers of this site are in the United States and Europe. The United States is now a net oil exporter and self-sufficient in natural gas, which the World Bank’s own regional work names as a source of insulation. So the country that normally transmits shocks to everyone else is, in this particular episode, among the better protected, while the economies taking the direct hit are the ones that buy energy on the seaborne market: the European household on a gas tariff, the Japanese and Korean utilities bidding against each other for the same cargo, the South and Southeast Asian importers with the least ability to outbid anyone. An American reader is not exempt, because a global oil price is a global oil price and a diesel bill is a diesel bill, but the sharpest end of this shock is being felt by people the American news cycle will not cover.
The Channel That Did Not Come Back Down
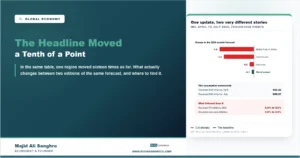
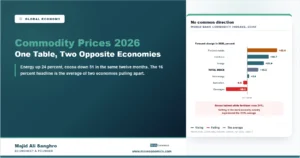
The third channel is the one this article exists for. The Gulf is a critical source of fertilizers, urea above all, and also of chemical inputs such as helium and sulfur and a large share of global aluminum supply. When the seaborne exports stopped, urea jumped more than 50 percent month on month in March, and, unlike oil, it had not come back down by mid-April. The World Bank’s forecast for the year makes the persistence explicit: urea at $675 a metric ton in 2026 against $423 in 2025, a rise of 59.7 percent, with the whole fertilizer index up 30.7 percent and revised up 46.4 index points from the October 2025 forecast. Nothing about that is dramatic on a screen. It is decisive on a farm. Fertilizer is bought before a crop is planted and paid for out of the previous harvest, so a 60 percent input shock lands on a cash position that was fixed months earlier, and it does not wait for the crop to sell well. The output side offers no relief either: the same table forecasts wheat up only 4.0 percent and rice down 1.7 percent, after rice had already fallen from $588 to $408 a metric ton between 2024 and 2025. Input costs explode, output prices do not, and the difference is the farmer’s margin.
That squeeze is the mechanism by which a shipping closure reaches a dinner plate, and the delay is the reason almost nobody connects the two when it arrives. Higher fertilizer costs feed into agricultural production costs, which feed into food prices with a lag measured in seasons rather than weeks, so the grocery bill that rises in 2027 will be discussed as a food story with no mention of a strait. Our article on why grocery bills climb works through that transmission, and the reason a farmer cannot simply pass the cost on is the ordinary economics of a price taker selling into a world market. It is also why the fertilizer line matters more than the barrel line for the poorest importing countries, where food is the largest single item in the household budget and the state has the least fiscal room to cushion it. The barrel price is watched by everyone with a screen. The urea price is watched by almost nobody, and it is still up.
MASEconomics Explains
3 economic concepts behind the shock
These concepts are explored in depth across our educational articles library.
Explore the MASEconomics BlogConclusion
The March 2026 oil supply shock was the largest on record by the World Bank’s own measurement: about 10 million barrels a day of lost supply, and a Brent price that went from $72 at the end of February to close March at $118, a rise of roughly 64 percent and the largest monthly increase in the institution’s series. Those are the numbers that led the coverage, and they are correct. They are also the fastest-healing part of the episode, because oil could partly reroute through spare pipeline capacity and had moderated back into the $90s within weeks, still high but no longer extreme. The wider economic consequences of that phase are covered in our piece on how the Hormuz crisis reshaped the global economy; this article is about the channels that outlast it.
The two channels that will outlast the headline are the ones with no escape valve and no audience. Liquefied natural gas cannot be rerouted at all, which is why the Asian benchmark rose 94 percent in a single month and why gas stayed elevated after oil eased, and why the burden falls on seaborne energy importers in Europe and Asia rather than on a United States that is now a net oil exporter and self-sufficient in gas. Fertilizer is the quieter one and probably the more consequential: urea rose more than 50 percent in March, had still not come down by mid-April, and is forecast to average 59.7 percent higher across 2026 while wheat rises 4 percent and rice falls. A shock that is measured in barrels will be paid for, a year or two from now, in the price of food by people who never saw the barrel. The headline number was the record. The story is what the record left behind.
Frequently Asked Questions
How large was the March 2026 oil supply shock?
Global oil supply fell by about 10 million barrels a day, which the World Bank describes as the largest oil supply shock on record, measured against historical episodes including Iraq’s invasion of Kuwait, the Gulf War, the September 2001 attacks, the Venezuelan oil strike, and the Libyan civil war. Brent rose from $72 at the end of February to close March at $118.
Why did gas prices rise more than oil prices?
Because oil could partly go around and liquefied natural gas could not. Roughly 5.5 million barrels a day of spare pipeline capacity was available to redirect crude, about 3 of which was used in March. There are no alternative routes for LNG, so the only adjustment was buyers competing for cargoes already at sea, which pushed the Asian benchmark up 94 percent over March.
Why does fertilizer matter more than the oil price here?
Because it did not come back down. The Gulf is a critical source of urea, and the price jumped more than 50 percent month on month in March and had still not eased by mid-April, when oil had. The World Bank forecasts urea 59.7 percent higher across 2026 while wheat rises 4 percent and rice falls 1.7 percent, which is a direct squeeze on farm margins.
Is the United States insulated from this shock?
Partly. The World Bank notes that the United States is now a net oil exporter and self-sufficient in natural gas, which gives it some insulation, so the sharpest effects fall on economies that buy energy on the seaborne market in Europe and Asia. That does not make American consumers exempt, since oil trades at a world price, but it does reverse the usual direction in which shocks travel.
When would ordinary shoppers notice this?
Energy shows up quickly, in fuel and heating bills within weeks. The fertilizer channel is slower: higher input costs raise agricultural production costs, which reach food prices with a lag measured in growing seasons. That delay is why the eventual rise in grocery bills will usually be reported as a food story rather than as a consequence of a closed shipping lane.
Thanks for reading! The barrel price made the headlines and then healed; the bag of urea made nobody’s headlines and is still expensive. Happy learning with MASEconomics