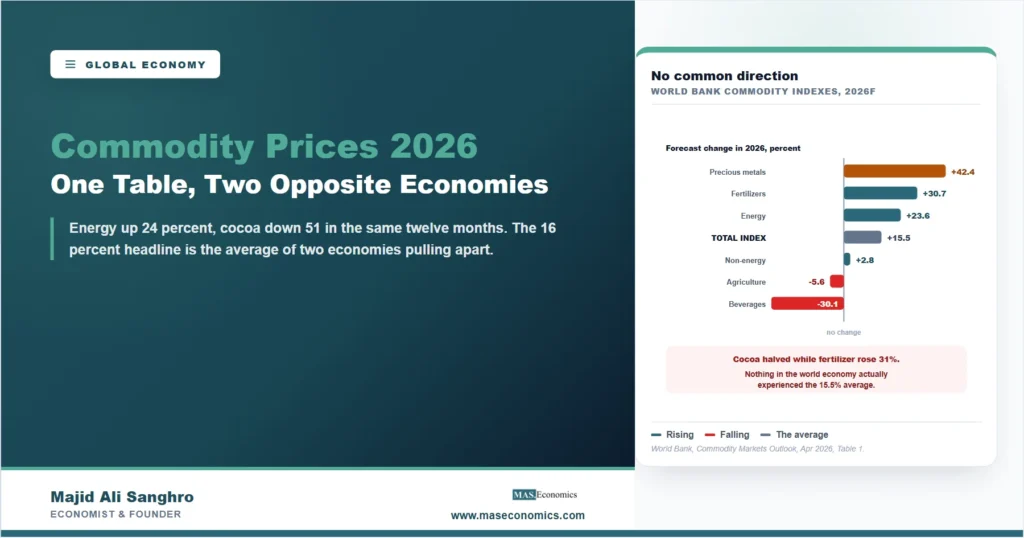
In the same year that energy prices surged and fertilizer became the fastest-rising input on the planet, the price of cocoa halved. It went from $7.80 a kilogram in 2025 to a forecast $3.80 in 2026, a fall of 51.3 percent, while the beverages index as a whole dropped 30.1 percent as the coffee and cocoa supply crunches of the previous years unwound. Meanwhile the fertilizer index is forecast up 30.7 percent and energy up 23.6 percent. All four numbers come from the same table, published by the same institution on the same day, describing the same twelve months. That is the fact worth sitting with before reaching for any summary of commodity prices 2026, because the World Bank’s headline figure for the year is that average commodity prices rise 16 percent, the first annual increase since 2022, and that single number is the average of a chocolate bar getting cheaper and a bag of urea getting 60 percent dearer. An average of two things moving in opposite directions describes neither of them.
The Average Is Describing Nobody
Sort the table by what actually happened and the year splits cleanly in two. On one side sit the things that move through the Gulf or are made from what moves through the Gulf: precious metals up 42.4 percent, fertilizers up 30.7, energy up 23.6, base metals up 19.2. On the other side sit the things that do not: agriculture down 5.6 percent and beverages down 30.1, with the non-energy index as a whole managing just 2.8. The total index lands at 15.5 percent, which is a real number and a misleading one, because nothing in the economy experienced 15.5 percent. A European utility experienced 23.6. A farmer buying nitrogen experienced 59.7, the forecast rise in the urea price from $423 to $675 a metric ton. A chocolate manufacturer experienced minus 51.3. The dispersion is the story and the mean is the thing that hides it. That is a standing hazard with aggregates, and the reason central banks maintain alternatives to their own headline measure, as our guide to core inflation explains. It becomes acute in a year where the shock came from a shipping lane rather than from world demand. When a boom is driven by demand, most prices move together and the average means something. When it is driven by the closure of a corridor, only the commodities that use the corridor move, and the average becomes an accounting artefact.
Prices Up, Trade Down, Inflation Stalled
The second thing the table will not tell you on its own is what kind of year this is, and for that the price data has to be read next to the quantity data. The IMF’s July 2026 update projects world trade volume growth slowing from 5.0 percent in 2025 to 3.5 percent in 2026 before recovering to 4.3 in 2027. So the volume of goods and services crossing borders is decelerating while the prices of the most traded physical inputs rise sharply. That combination is diagnostic. A commodity price rise driven by a strong world economy comes with trade volumes rising too, because the same demand that lifts the price lifts the shipments. A rise that arrives alongside slowing trade is a supply event, and it transfers income rather than creating it. The inflation numbers confirm the reading from the third side. The IMF now expects global headline inflation to rise from 4.1 percent in 2025 to 4.7 percent in 2026 before easing to 3.9 in 2027, a projection revised up 0.3 percentage points from April and driven mainly, in the Fund’s own words, by higher energy and food prices. Its summary of what that means is blunt: the disinflation trend in place since the beginning of 2024 has stalled. This is the textbook signature of a supply shock rather than a boom, the pattern our explainer on cost-push against demand-pull sets out, and the reason the 2022 comparison keeps coming up is that the last energy shock produced the same three-way pattern.
It matters who is on each side of that transfer, because a table like this is a windfall and a bill at the same time depending on where you read it from. Every one of these lines has a producer collecting and a buyer paying. Higher energy is revenue for an exporter and a cost for a manufacturer. Higher fertilizer is margin for a Gulf petrochemical plant and a squeeze on a farmer who buys the input before planting and sells the output at a price the same table forecasts flat, with wheat up 4.0 percent and rice down 1.7. Cheaper cocoa is relief for a confectioner and a collapse in earnings for a West African grower whose national budget was built on the previous price. The countries that gain are mostly the ones exporting the corridor commodities; the countries that lose are mostly the ones importing food and energy, which is to say the poorest importers, where those two categories take the largest share of the household budget. Our article on why grocery bills climb follows that last channel to the shelf, and the formal version of the gains-and-losses argument is the terms of trade.
Even the Forecasters Disagree About the Input
One more caution belongs on any use of these numbers, and it is the sort of thing that never survives a summary. The two institutions whose projections drive most published inflation forecasts do not agree about the single most important input to them. The World Bank has Brent crude averaging $86 a barrel in 2026, a rise of 24.6 percent on 2025. The IMF’s own oil price assumption for the same year is a rise of 31.8 percent. That is a gap of roughly seven percentage points on the price that sets the energy line, feeds the fertilizer line through gas costs, and drives the food line through production and transport, which means the two global inflation forecasts everyone quotes are not built on the same world. Neither is wrong; they use different baskets, different cutoffs and different assumptions about how fast Gulf shipping returns, and the World Bank’s own baseline explicitly assumes the acute disruption ends in May with volumes back near pre-war levels by October. Change that assumption and the whole table changes with it.
The practical instruction is to treat every number here as conditional on a shipping schedule nobody controls, and to notice how rarely that condition is repeated when the figures are quoted. The World Bank says as much in its own framing, describing the forecast as subject to heightened uncertainty and noting that its baseline already represents a 25 percent upward revision from what the same institution projected in January. A projection that moved 25 percent in three months is not a fact about 2026, it is the best current reading of a situation still moving, and the honest way to use it is for direction and relative magnitude rather than for the decimal place. What the table establishes solidly is the shape: corridor commodities up hard, everything else flat or falling, trade volumes slowing, and disinflation stalled, which together are the milder form of the conditions our explainer on inflation alongside weakening activity examines at its extreme. Those four things are true across both forecasters and both baselines, and they are what an ordinary reader actually needs.
MASEconomics Explains
3 economic concepts behind the table
These concepts are explored in depth across our educational articles library.
Explore the MASEconomics BlogConclusion
The story of commodity prices 2026 is not a boom and it is not captured by the 16 percent headline. It is a split. The commodities that move through the Gulf, or are made from what does, rose hard: precious metals 42.4 percent, fertilizers 30.7, energy 23.6, base metals 19.2. Everything else went flat or fell, with agriculture down 5.6 percent and beverages down 30.1 as cocoa halved from $7.80 to a forecast $3.80 a kilogram. The total index of 15.5 percent is the average of those two opposite economies, and no producer, buyer or household actually experienced it. Reading the dispersion instead of the mean is the difference between knowing that commodity prices rose and knowing which ones, for whom, and why.
Two further readings make the table usable. Set the prices against the quantities and the year identifies itself: world trade volume growth slowing from 5.0 to 3.5 percent, global inflation revised up to 4.7 percent, and the IMF stating that the disinflation in place since early 2024 has stalled, which is the signature of a supply shock transferring income rather than a boom creating it. And hold every figure against the assumption underneath it, because the World Bank’s baseline requires the acute disruption to end in May with shipping back near pre-war levels by October, its own projection already moved 25 percent in three months, and the two institutions everyone quotes differ by about seven percentage points on the oil price that drives the rest. The shape is solid and worth carrying. The decimal places are a snapshot of a situation still in motion.
Frequently Asked Questions
How much are commodity prices rising in 2026?
The World Bank’s total commodity price index is forecast up about 16 percent, the first annual rise since 2022. That average conceals a wide split: energy is up 23.6 percent and fertilizers 30.7, while agriculture is down 5.6 percent and beverages down 30.1. The total index also excludes precious metals, which are forecast up 42.4 percent.
Why did cocoa fall while energy surged?
Because they were driven by different things. Cocoa is forecast to fall 51.3 percent, from $7.80 to $3.80 a kilogram, as the supply crunches that had pushed cocoa and coffee to extremes in previous years unwound. Energy rose because a shipping corridor closed. Only commodities that use that corridor were affected, which is why the two moved in opposite directions in the same year.
Is this a commodity boom?
No, and the trade data is what settles it. A demand-driven boom lifts prices and shipment volumes together. Here the IMF projects world trade volume growth slowing from 5.0 percent in 2025 to 3.5 percent in 2026 while prices rise, and expects global inflation to increase to 4.7 percent, stating that the disinflation trend since early 2024 has stalled. That pattern identifies a supply shock, which transfers income rather than creating it.
Who gains and who loses from this table?
Every line has a producer collecting and a buyer paying. Exporters of energy, fertilizer and metals gain; manufacturers and importers of those inputs pay. Farmers are squeezed from both sides, with urea forecast up 59.7 percent while wheat rises 4.0 percent and rice falls 1.7. Cheaper cocoa helps confectioners and damages growing economies whose budgets were built on the higher price.
How much should these forecasts be trusted?
For direction and relative size, not for precision. The baseline assumes the acute disruption ends in May with Gulf shipping near pre-war levels by October, and it already represents a 25 percent upward revision from the same institution’s January projection. The World Bank and the IMF also differ by roughly seven percentage points on the 2026 oil price, which drives most of the rest of the table.
Thanks for reading! When the average of a table is a number nobody in the economy actually paid, the interesting information is in how far apart the rows have moved. Happy learning with MASEconomics