In July 2026 the International Monetary Fund published its mid-year update and moved its forecast for world growth this year from 3.1 percent to 3.0. A tenth of a point, after three months in which a war was still running and oil was still disrupted. The Fund described the picture as broadly unchanged, and by that measure it was. Inside the same table, its forecast for growth in the Middle East and North Africa fell from 1.1 percent to minus 0.5, a move sixteen times larger than the one in the headline, and its forecast for the same region in 2027 rose by two and a half points. That is what a forecast revision usually looks like: a headline engineered to be stable sitting on top of components that are not, plus a set of assumptions in the footnotes that changed more than either. Reports arrive in editions, and almost everything worth knowing is in the difference between them.
The Sentence the Fund Wrote About Its Own Update
The July update states the problem in its own words. The broadly unchanged overall picture compared with the April edition, it says, conceals substantial cross-country variation. That is not a caveat buried in an annex. It is the second sentence of the forecast summary, and it is a direct instruction about how to read the document, which almost no coverage of the document follows.
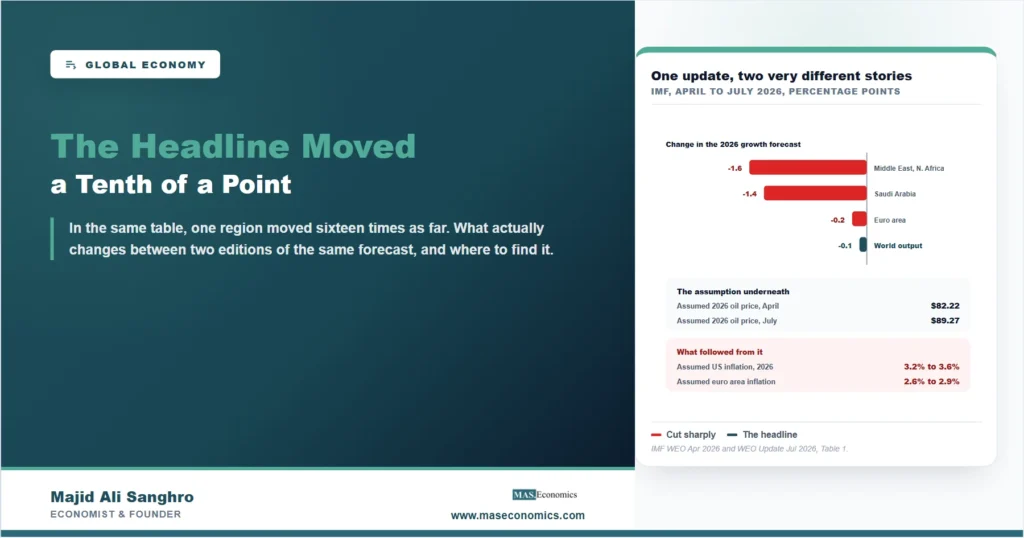
The variation is easy to see once the revision column is open, and the Fund prints one. Against April, its 2026 growth forecast moved by nothing at all for the United States, by minus 0.2 for the euro area, by minus 0.3 for France and minus 0.4 for Canada, by plus 0.2 for China and the United Kingdom, and by plus 0.5 for Brazil. Those are ordinary adjustments. Then there is the war’s neighborhood: Saudi Arabia cut by 1.4 points to 1.7 percent, the Middle East and Central Asia grouping cut by 1.2 to 0.7 percent, and the Middle East and North Africa aggregate cut by 1.6 points into outright contraction. The world number barely moved because the world is very large and the region is not, a point about weighting rather than about economics, and the same arithmetic that makes purchasing power parity weights produce a different global total from market exchange rates.
The growth rows are also the wrong place to look, because they are not where the movement is. In the same update, the projection for world trade volume in 2026 was raised by 0.7 points to 3.5 percent, the oil price projection was raised by 10.4 points to a rise of 31.8 percent, and nonfuel commodity prices were cut by 3.1 points. Those are whole-point moves sitting beside growth adjustments measured in tenths, and the pattern is consistent across editions rather than a quirk of this one. Quantities of output are slow and heavily averaged. Prices and trade volumes are neither. So the sentence “the Fund revised its forecast” describes something quite different depending on which line of the table it refers to, and the line that usually reaches a household budget is not the one in the headline.
Every Projection Has a Date Stamped Inside It
The more useful difference between the two editions is not in the table at all. It is in the footnotes, where a forecast declares what it assumed. Both editions state the oil price they were built on, and both state where that price came from: not a view, but a futures curve read on a particular set of days. In April the assumed 2026 oil price was $82.22 a barrel. In July it was $89.27, taken from futures as of 10 June 2026. Exchange rates get the same treatment. April held real effective exchange rates constant at their levels between 10 February and 10 March 2026; July held them at their levels between 11 May and 8 June.
Once those inputs are visible, the rest of the revision stops being mysterious. An assumed oil price seven dollars higher runs through the machinery and comes out as higher assumed inflation, and that is exactly what happened: the assumed 2026 inflation rate for the United States moved from 3.2 percent to 3.6, and for the euro area from 2.6 percent to 2.9, which is the same direction that took euro area inflation to nearly double in four months. World consumer prices went from 4.4 percent to 4.7. None of that is a change of mind about how economies work. It is the same model fed a newer price.
| The assumption | April 2026 edition | July 2026 update |
|---|---|---|
| Oil price for 2026 | $82.22 a barrel | $89.27 a barrel |
| Where the oil price came from | Futures markets | Futures markets, as of 10 June 2026 |
| Exchange rates held at the levels of | 10 February to 10 March 2026 | 11 May to 8 June 2026 |
| Assumed United States inflation, 2026 | 3.2 percent | 3.6 percent |
| Assumed euro area inflation, 2026 | 2.6 percent | 2.9 percent |
| World consumer prices, 2026 | 4.4 percent | 4.7 percent |

|
||
This is worth knowing for a practical reason. A reader who disagrees with a forecast usually disagrees with an assumption rather than with the analysis, and the assumption is printed. If you believe oil will settle below $89 for the rest of 2026, you do not need to build a rival model of the world economy. You can take the Fund’s own arithmetic and note which way its inflation numbers would move, in the way a market reader treats the Federal Reserve’s dot plot as a conditional statement rather than a promise. That is a far more productive argument than the usual one about whether institutions are too optimistic.
It also explains why forecasters cluster. Several of them read the same futures curves in the same week, so their oil assumptions are close by construction and their inflation projections inherit that closeness. Agreement between institutions is therefore weaker evidence than it looks, because it can reflect a shared input rather than independent judgment. The place to look for genuine disagreement is not the headline numbers but the assumptions, and where those are identical, two forecasts are closer to one forecast published twice.
The Assumption With a Date On It
Some assumptions are conditional on something specific happening by a specific month, and those are the ones to write down, because they expire in public. The clearest example on the current shelf belongs to the World Bank. Its April 2026 commodity outlook projects average commodity prices rising 16 percent this year, the first annual increase since 2022, and states the condition in the same sentence: this assumes the most acute phase of trade disruption ends in May, with shipping volumes through the Strait of Hormuz gradually returning to near pre-war levels by October.
That is a forecast with a deadline written into it. The war that produced the disruption began on 28 February 2026, and the March supply loss of about 10 million barrels a day is described by the Bank as the largest on record. The April projection was already 25 percent above what the same institution had expected in January. All of that follows from an assumption about when a forty-kilometer chokepoint reopens, and the next edition of that report is due in October, which is the month the assumption named. It will be the first document able to report on its own condition. If shipping is back, the price path unwinds and the inflation revisions built on it should unwind too. If it is not, the April baseline was the optimistic case and everything downstream of it was too low, including the numbers in the 2026 oil shock as they stood in the spring.
Neither outcome would make the April report wrong. A conditional forecast whose condition fails is not an error, it is a forecast that told you what it depended on. The failure is on the reading side, when the condition is stripped off and the number is quoted alone. That is how a projection acquires an authority its authors never claimed for it, and it is the same mechanism, running in a different direction, that produces the recurring surprise at oil price shocks that were always possible and never forecast.
What to Read First When a Report Lands
Four things, in this order, and none of them is the press release. First, the revision column, if the report prints one. The IMF does, in the main table of every edition, and it is the fastest way to see what the institution actually changed its mind about. Second, at least one component underneath the headline. An aggregate is a weighted sum designed to be stable, so a world number that has not moved is not evidence that nothing happened. Third, the assumptions, which live in the footnotes to the main table and name the prices, exchange rates and dates the projection was built on. Fourth, the definition of any aggregate being compared across editions.
That fourth check is the one that catches the most embarrassing errors. The World Bank’s April 2026 regional update for the Middle East, North Africa, Afghanistan and Pakistan states its regional growth figure excluding Iran; the previous October’s edition did not. Subtract the two headline numbers and you get a war costing about 1.5 points of regional growth. The Bank’s own stated downgrade is 2.4 points, measured against its January projections, and the tell that something is wrong is that the two editions disagree by more than a point about 2025, a year that was almost over when the later one was written. Two documents cannot disagree that much about the past unless they are describing different things. The habit generalizes, and it is the same discipline our piece on conflicting economic statistics applies to numbers that disagree across institutions rather than across editions.
None of this requires reading a two-hundred-page document on the day it appears. It requires reading one table, one component, one footnote and one definition, which takes about twenty minutes and produces a better account of what changed than most same-day coverage, including coverage written by people who attended the meetings where these reports are discussed. The reason is not effort. It is that the interesting content of an edition is defined by the previous edition, and a reader who does not have the previous one cannot see it.
MASEconomics Explains
3 economic concepts behind reading an edition
These concepts are explored in depth across our educational articles library.
Explore the MASEconomics BlogConclusion
A forecast revision is the most informative part of a forecast report and the least reported. Between April and July 2026 the International Monetary Fund moved its world growth number for the year by a tenth of a point and called the picture broadly unchanged, while cutting the Middle East and North Africa by 1.6 points into contraction, raising the same region for 2027 by 2.5, and lifting its assumed 2026 inflation rates for the United States and the euro area by 0.4 and 0.3. The assumptions moved further than the outputs: an oil price of $82.22 a barrel became $89.27, read from futures on 10 June, and the exchange rate window shifted by three months. Every one of those figures is printed by the institution itself, in a revision column and a set of footnotes that exist precisely so the change can be traced.
The reading habit that follows is short. Open the revision column, check one component under the headline, find the assumptions and their dates, and confirm the aggregate is defined the same way it was last time. It costs about twenty minutes on the day a report lands, and it is the difference between knowing that an institution published a number and knowing what it changed its mind about. The October editions of the IMF and World Bank flagships are due within weeks of each other, and one of them carries an assumption that named October by name.
Frequently Asked Questions
What is a forecast revision?
The change in a projection between two editions of the same report. Major forecasters publish on a fixed cycle, so each edition restates the same variables with newer information, and many print the difference from the previous edition directly in the main table. The revision shows what the institution changed its mind about, which the level alone cannot.
Why did the IMF’s world growth number barely move when the regional numbers moved a lot?
Because a world aggregate is a weighted sum across roughly two hundred economies. A shock concentrated in one region has to be extraordinarily large to shift it. Between April and July 2026 the Middle East and North Africa forecast for 2026 was cut by 1.6 percentage points while world output was cut by 0.1. The stability of the headline is arithmetic, not evidence that the shock was small.
Where do I find the assumptions behind a forecast?
In the footnotes to the main projections table. The IMF states its assumed oil price, the futures date it was read from, the exchange rate window held constant, and the assumed inflation rates for the largest economies. The July 2026 update assumed $89.27 a barrel from futures as of 10 June, against $82.22 in April.
Is a forecast wrong if its assumption turns out to be false?
Not by itself. A conditional forecast states what it depends on, and a condition that fails tells you the projection no longer applies rather than that the analysis was poor. The problem arises when the condition is dropped and the number is quoted alone, which gives the projection an authority its authors did not claim.
How can I tell if two editions are safe to compare?
Check whether they agree about a year that has already finished. If two editions of the same report give noticeably different figures for a past or nearly complete year, they are defining the aggregate differently and the difference between their forecasts is not meaningful. A World Bank regional series showed exactly this in 2026, when one edition excluded a country the previous one had included.
Thanks for reading! The most useful line in a forecast report is usually a footnote naming the day somebody read a futures curve. Happy learning with MASEconomics