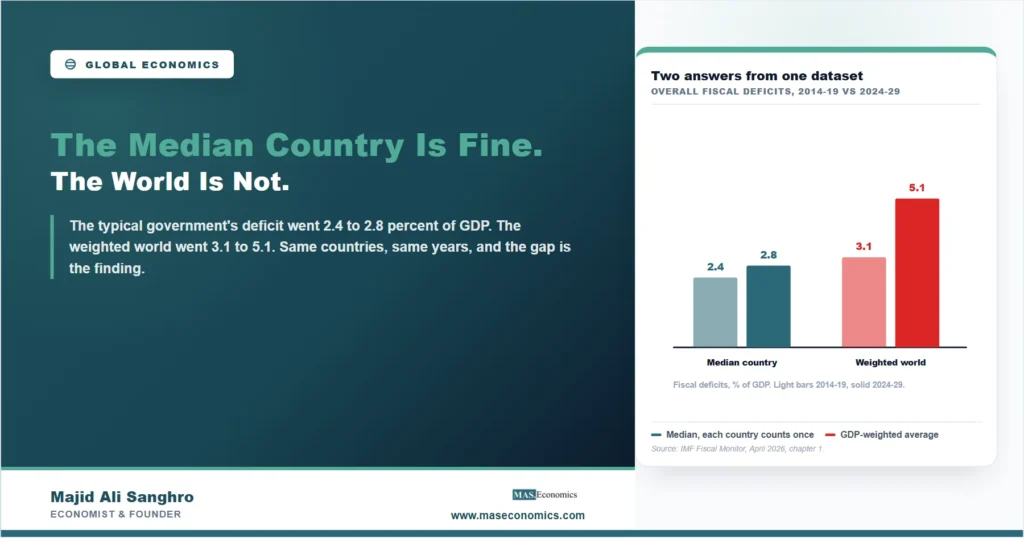
Ask the IMF’s fiscal database how government finances have changed since before the pandemic and it returns two answers about the same countries over the same years. The typical country’s deficit has barely moved: the median overall balance went from 2.4 percent of GDP in 2014 to 2019 to 2.8 percent for 2024 to 2029. The global fiscal deficit, weighted by economic size, went from 3.1 percent to 5.1 percent over exactly the same comparison. One statistic describes a world that adjusted after an emergency. The other describes a world borrowing at nearly twice its pre-pandemic pace. Both are correct, and the distance between them is the story.
This is not a statistical curiosity. Anyone who lends to governments, prices sovereign bonds, or wonders whether the next crisis finds fiscal room to respond needs to know which of those two worlds they live in. The answer, uncomfortably, is that it depends on where they live, and the aggregate has stopped being a useful guide to the typical experience.
Two Averages, One Dataset
A median and a weighted average answer different questions. The median lines all the countries up by deficit size and reads the middle one, so each government counts once: Denmark and the United States are one observation each. The weighted average counts each government in proportion to the size of its economy, which means a handful of large economies effectively set the number. When the two move together, the world is moving together. When they split, as they have here, something specific is true: the deterioration is concentrated in the biggest economies, and the bigger the economy, the worse the drift.
The IMF names the mechanism in the same chapter. The United States is running a general government deficit of 7 to 8 percent of GDP while operating near full capacity, with gross debt projected to reach 142 percent of GDP by 2031. China’s fiscal expansion has widened its deficit to nearly 8 percent. Two economies that together dominate any weighted average are borrowing at rates the median country never approached, and the average faithfully reports their behavior as if it were the world’s.
The Debt Stock Tells the Same Story
| Measure | 2014-2019 | 2024-2029 | Change |
|---|---|---|---|
| Median country’s overall deficit, percent of GDP | 2.4 | 2.8 | +0.4 points |
| GDP-weighted world deficit, percent of GDP | 3.1 | 5.1 | +2.0 points |
| GDP-weighted world debt, percent of GDP | 79.8 | 96.2 | +16.4 points |

|
|||
The debt row completes the picture. The weighted world debt ratio rises from 79.8 to 96.2 percent of GDP across the comparison, while, in the IMF’s words, the median economy exhibits a manageable increase. Global government debt reached nearly 94 percent of world GDP in 2025 and is on course to pass 100 percent by 2029, a level last seen in the aftermath of World War II. Every point of that climb is real, and almost all of it belongs to the economies at the top of the weight distribution. The framework for judging whether any given trajectory is survivable is the subject of our explainer on debt sustainability; what the median-weighted split adds is the knowledge that the question is acute for a few enormous borrowers rather than for the typical one.
Who Is Inside Each Number
The reflex is to treat the weighted average as the honest number and the median as a trick, and the reflex is wrong in both directions. For some questions the weighted average is exactly right. World interest rates, global demand, the supply of safe assets and the pricing pressure on every borrower are all driven by dollars borrowed, and a dollar of American borrowing weighs the same as a dollar of anyone’s. That is the world in which the American interest bill we examined in where $1.2 trillion goes crowds global capital markets, and in which the transmission effects analyzed in our piece on what high public debt does to a rate cut operate at full scale.
For other questions the median is the honest number. Ask what fiscal position the typical finance ministry actually faces, whether the ordinary country used the post-pandemic years to rebuild its buffers, or how many governments could respond to the next shock, and the median answers while the average misleads. A 5.1 percent world deficit does not mean most governments are borrowing 5.1 percent of GDP; most are borrowing far less, and a meaningful group has been consolidating. The concept doing the work here is fiscal space, and the split says that space has evaporated where the money is, not where most governments are.
The practical consequence runs through bond markets. The economies driving the weighted average are the ones issuing the bonds that anchor global pricing, so the deterioration that the median hides is precisely the deterioration that sets the term premiums, the spreads and the long rates every other borrower pays. A typical country with tidy finances still refinances into a world price of duration made by the untidy giants. That is the channel through which a statistical artifact becomes everyone’s mortgage rate, and it is why the split matters to readers far from any finance ministry.
This piece is the second in an accidental series. Our study of conflicting economic statistics showed four cases where two published numbers about the same fact disagreed because they measured different things, and our companion article this week shows the IMF and World Bank agreeing about global growth behind headlines that appear to split. The median-weighted gap is the same lesson from inside a single dataset: before quoting an aggregate, ask what question it answers, because the other aggregate in the same table may answer yours.
MASEconomics Explains
3 economic concepts behind the split
These concepts are explored in depth across our educational articles library.
Conclusion
The global fiscal deficit is 5.1 percent of GDP or 2.8 percent, depending on whether you weight governments by the size of their economies or count each one once, and the two-point gap between those readings is itself the finding. The typical country’s finances have drifted modestly since the pre-pandemic years. The world’s largest economies have moved from 3.1 to 5.1 percent deficits and carried the weighted debt ratio from 79.8 toward 96.2 percent of GDP, with the global total on course to pass its World War II-era mark of 100 percent by 2029.
Neither number deserves the word wrong. The weighted average is the truth about global capital markets, the supply of bonds and the pressure on world interest rates; the median is the truth about the government the average country actually runs. The error is quoting either as if it were the other, and the concentration the gap reveals is the useful fact: the world’s fiscal problem is not everywhere, it is specifically at the top of the weight distribution, in the economies whose bonds set the price of money for everyone else.
Frequently Asked Questions
How can the median and the weighted average differ this much?
Because economic size is extremely concentrated. A weighted world average is effectively set by a handful of very large economies, so when the United States and China run deficits near 8 percent of GDP, the average follows them. The median, where every country counts once, keeps describing the typical government instead.
Which measure is the right one?
Each answers a different question. Use the weighted average for global capital markets, bond supply and world interest rate pressure, because those run on dollars borrowed. Use the median for what the typical government’s position looks like and how widespread fiscal stress actually is.
Does a stable median mean most countries are fiscally healthy?
It means the typical country’s deficit has moved little since the pre-pandemic period, from 2.4 to 2.8 percent of GDP. Health varies enormously within that: many governments still carry debt above their pandemic peaks, and low-income countries face high borrowing costs. The median rules out a universal deterioration, not individual trouble.
Why should someone outside the big economies care about the weighted number?
Because the economies driving it issue the bonds that anchor global pricing. Their borrowing sets term premiums and long rates worldwide, so a country with tidy finances still refinances at prices made by the large deficits. The weighted average is, in effect, the world’s cost of capital in the making.
Where do these figures come from?
From the IMF’s April 2026 Fiscal Monitor, which publishes both the median and the GDP-weighted comparison of 2014-2019 against 2024-2029 across its full country sample, alongside the debt ratios. The report’s own text draws attention to the divergence rather than burying it.
Thanks for reading! When one dataset hands you two different worlds, the distance between them is usually the most informative number on the page. Happy learning with MASEconomics