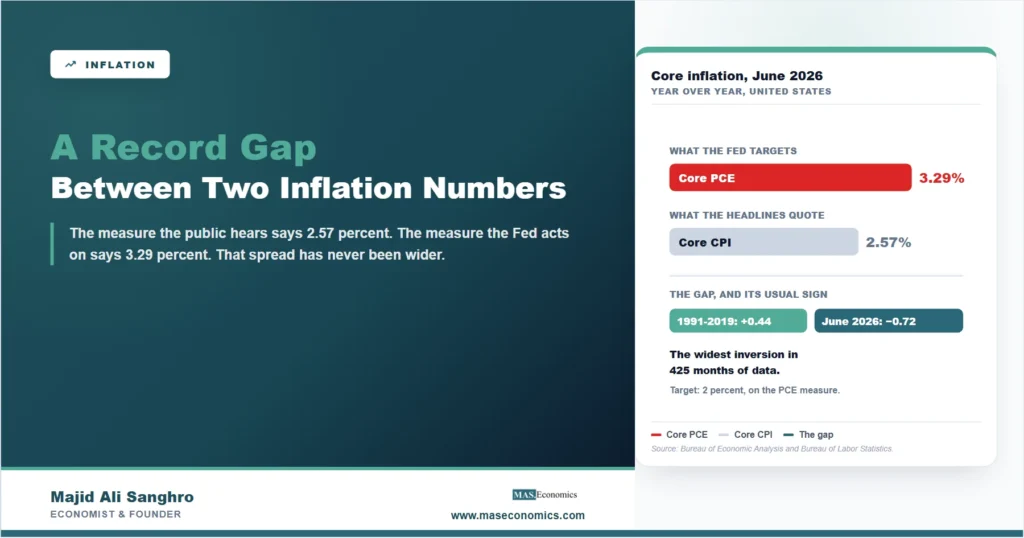
Two American inflation numbers were published for June 2026. One said underlying prices were rising 2.57 percent over the year. The other said 3.29 percent. Both are official, both are careful, and both describe the same economy in the same month. The difference between them is the difference between an economy that has nearly finished its inflation problem and one that is still more than a point away from target. The core PCE vs core CPI gap is now the widest in this direction in the entire monthly record, and the number the Federal Reserve acts on is the unfriendly one.
This is not a story about a statistical curiosity. It is the reason a reader can see a headline saying inflation is close to target and then watch the central bank leave interest rates alone for another meeting. The mortgage rate quoted this week, 6.69 percent on a thirty-year fixed loan, sits on the same fact.
Four Numbers for One Economy
The United States produces two consumer price measures. The Bureau of Labor Statistics publishes the consumer price index, which is the number that reaches the news. The Bureau of Economic Analysis publishes the personal consumption expenditures price index, which is the number the Federal Reserve adopted as its target measure in 2000. Each comes in a headline version and a core version that removes food and energy.
| Measure | Annual rate | Distance from the 2 percent target |
|---|---|---|
| Core PCE, the Fed’s target measure | 3.29% | +1.29 points |
| Core CPI | 2.57% | +0.57 points |
| Headline PCE | 3.67% | +1.67 points |
| Headline CPI | 3.46% | +1.46 points |

|
||
Read the first two rows again. The measure the central bank has committed itself to is running three quarters of a point hotter than the measure the public hears about. Anyone following the story through the consumer price index alone is watching an economy where the inflation problem is nearly solved. Anyone sitting on the Federal Open Market Committee is looking at one where it is not.
The Gap Almost Always Runs the Other Way
What makes June 2026 unusual is not that the two measures disagree. They always disagree, and economists have known which way for thirty years. The consumer price index normally runs above the PCE index. Between January 1991 and December 2019, core CPI inflation exceeded core PCE inflation in 298 of 348 months, and the average distance was 0.44 points. That wedge is a documented consequence of how the two indexes are built.
In June 2026 the wedge is minus 0.72 points. Core CPI is below core PCE by more than it has ever been below it in a record that begins in January 1991 and runs to the present, 425 months. It is not the largest gap between the two measures, which is a different question. It is the largest gap in this direction, and the previous record, minus 0.70 points, was set in May 2010 in the aftermath of the financial crisis.
Three Reasons the Two Indexes Never Agree
The two measures differ in scope, in weights, and in formula, and each difference pushes in a known direction.
Scope is the largest. The consumer price index measures what urban households pay out of their own pockets. The PCE index measures all consumption on behalf of households, which includes the medical care that employers and government programs pay for directly. A hospital bill settled by an insurer barely touches the consumer price index and enters the PCE index at close to its full value. That single difference makes health care a much larger part of the Fed’s measure than of the public’s.
Weights are the second. Both indexes cover housing, but the consumer price index gives shelter roughly a third of its basket, far more than the PCE index does, because the PCE weights come from national accounts rather than from a household spending survey. When rents move, the consumer price index feels it much more.
Formula is the third, and it is the one that explains the usual direction of the wedge. The PCE index updates its weights continuously to reflect what people actually bought as prices changed, while the consumer price index holds a basket fixed for longer. Consumers substitute away from what has become expensive, and an index that watches them do it records a slightly lower rate of inflation than one that does not. That mechanical difference is why core CPI ran above core PCE in six of every seven months for three decades. It has not stopped operating. It is being overwhelmed.
The Usual Suspect Runs the Wrong Way
The first place to look when the two measures separate is shelter, since that is where their weights differ most. The natural story writes itself: rents cool, the consumer price index feels it three times as hard as the PCE index, and core CPI drops below core PCE. It is a good story and the data does not support it.
In June 2026 owners’ equivalent rent, the largest single component of American shelter costs, was rising at 3.25 percent over the year. Core CPI was rising at 2.57 percent. Shelter is not dragging the consumer price index down. It is holding it up, and core CPI would be lower still without it. The measure that is supposed to be inflated by housing is running below the measure that is barely exposed to housing.
That leaves the parts of the basket where the PCE index carries the heavier weight, and health care is the obvious candidate on weights alone. This is where honesty is worth more than a tidy ending. The monthly component detail that would settle the attribution is published by the Bureau of Economic Analysis and has not been checked here, so the attribution is not made. What can be said, and is enough, is that the gap is not coming from housing, and that it is coming from somewhere the Federal Reserve’s measure sees more clearly than the public’s does.
Why This Decides the Rate Path and the Mortgage
The Federal Reserve did not choose its measure recently or casually. It moved to the PCE index in 2000 and has stated its 2 percent goal in terms of that index ever since, including in the 2020 shift to average inflation targeting. A committee looking at 3.29 percent is looking at an economy where underlying inflation is still more than a point above where it has promised to keep it.
The shorter window says the same thing. Over the three months to June, core PCE was running at 2.89 percent annualised against 2.29 percent for core CPI. The gap is not an artefact of one unusual month a year ago dropping out of the comparison. It is in the recent data as well.
That is the mechanism behind a household experience that otherwise looks contradictory. The effective federal funds rate averaged 3.63 percent in July, the thirty-year mortgage rate was 6.69 percent in the first week of August, and the news that week could accurately report inflation of 2.57 percent. A reader who takes the consumer price index as the measure of record concludes that policy is unaccountably tight. A reader who knows which index the committee is bound to gets a straightforward answer. The gap between what the Fed has done and what mortgage borrowers have felt has the same root.
Why the American Wedge Reaches Other Countries
An inflation gap inside American statistics would be a domestic matter if the dollar were a domestic currency. It is not. The federal funds rate sets the price of the world’s reserve currency, and the ten-year Treasury yield, 4.69 percent in the first week of August, is the reference against which sovereign and corporate borrowing is priced from Frankfurt to Jakarta. A committee that stays on hold because its own measure is 1.29 points above target is holding the floor under borrowing costs everywhere, including in economies whose own inflation has already returned to target.
For a European or Canadian reader the practical consequence is that a domestic rate cut delivers less relief than it should, because long rates are anchored abroad. For a developing economy with dollar debt it is more direct, since the coupon is set by a committee reading an index that measures American health spending. That is what it means for one country’s statistical convention to be the world’s monetary anchor, and it is a reason to know which index is being quoted before drawing a conclusion from it. Other cases where two credible statistics disagree are collected in our guide to reading conflicting economic statistics.
MASEconomics Explains
3 economic concepts behind the inflation gap
These concepts are explored in depth across our educational articles library.
Conclusion
The core PCE vs core CPI gap has reversed and set a record. For three decades the consumer price index ran about half a point above the Federal Reserve’s measure, and in June 2026 it ran 0.72 points below it, the widest inversion in a record going back to 1991. The friendlier of the two numbers is the one that reaches the public, and the tougher one is the one the central bank has bound itself to.
Housing, the difference most people reach for first, is not the explanation here, since shelter is currently holding the consumer price index up rather than pushing it down. The difference lies in the parts of consumption the Fed’s measure weights more heavily, and the component detail needed to name them precisely has not been examined here. What does not require further work is the practical point. Until core PCE comes down, the rate path is set by a number most readers have never seen quoted, and the mortgage market, the Treasury curve and every borrower priced off the dollar will keep answering to it.
Frequently Asked Questions
Which inflation measure does the Federal Reserve target?
The personal consumption expenditures price index, published by the Bureau of Economic Analysis. The Fed adopted it as its reference measure in 2000 and states its 2 percent goal in terms of it. The consumer price index, published by the Bureau of Labor Statistics, is the more widely reported number but has no formal standing in the policy decision.
How big is the gap between core PCE and core CPI right now?
In June 2026 core PCE inflation was 3.29 percent and core CPI inflation was 2.57 percent, a difference of 0.72 points. That is the largest gap in this direction in the monthly record since January 1991. The previous record was 0.70 points in May 2010.
Why does the consumer price index usually run higher?
Mainly because of how the basket is updated. The PCE index reweights continuously as spending patterns change, so it captures consumers substituting away from goods that have become expensive. The consumer price index holds its basket fixed for longer and therefore records a slightly higher rate. Between 1991 and 2019 core CPI exceeded core PCE in 298 of 348 months, by 0.44 points on average.
Is the gap caused by housing costs?
No, and the test runs against that explanation. Housing is weighted far more heavily in the consumer price index, so a cooling shelter component would pull it below the PCE measure. But owners’ equivalent rent was rising 3.25 percent in June 2026 against core CPI of 2.57 percent, which means shelter is holding the consumer price index up, not down.
Does the gap change what the Fed will do?
It changes how the decision reads from outside. On the target measure, underlying inflation is 1.29 points above 2 percent, and on the three-month annualised basis it is 2.89 percent. Both are consistent with a committee that waits. On the consumer price index the same economy looks much closer to done, which is why the policy stance can appear tighter than the news suggests it needs to be.
Which number should a reader follow?
Follow the consumer price index for the cost of living out of your own pocket, since that is what it is built to measure. Follow core PCE when the question is what the Federal Reserve will do, since that is the series it has committed to. Confusing the two is how a reader ends up expecting rate cuts that the committee’s own mandate does not support.
Thanks for reading! Two honest measurements of the same thing can point in different directions, and knowing which one carries the policy is most of the skill in reading inflation data. Happy learning with MASEconomics