In April 2024, the European Central Bank revised its climate roadmap to embed climate-related risks more deeply into supervision, monetary operations, and financial stability work. A few months later, the IMF estimated that delivering the Paris targets requires global investment of roughly USD 2.4 trillion per year in clean energy by 2030, with emerging markets needing the steepest scale-up. Green macroeconomics is the new field that takes these numbers seriously and asks what they mean for the standard tools of fiscal and monetary policy.
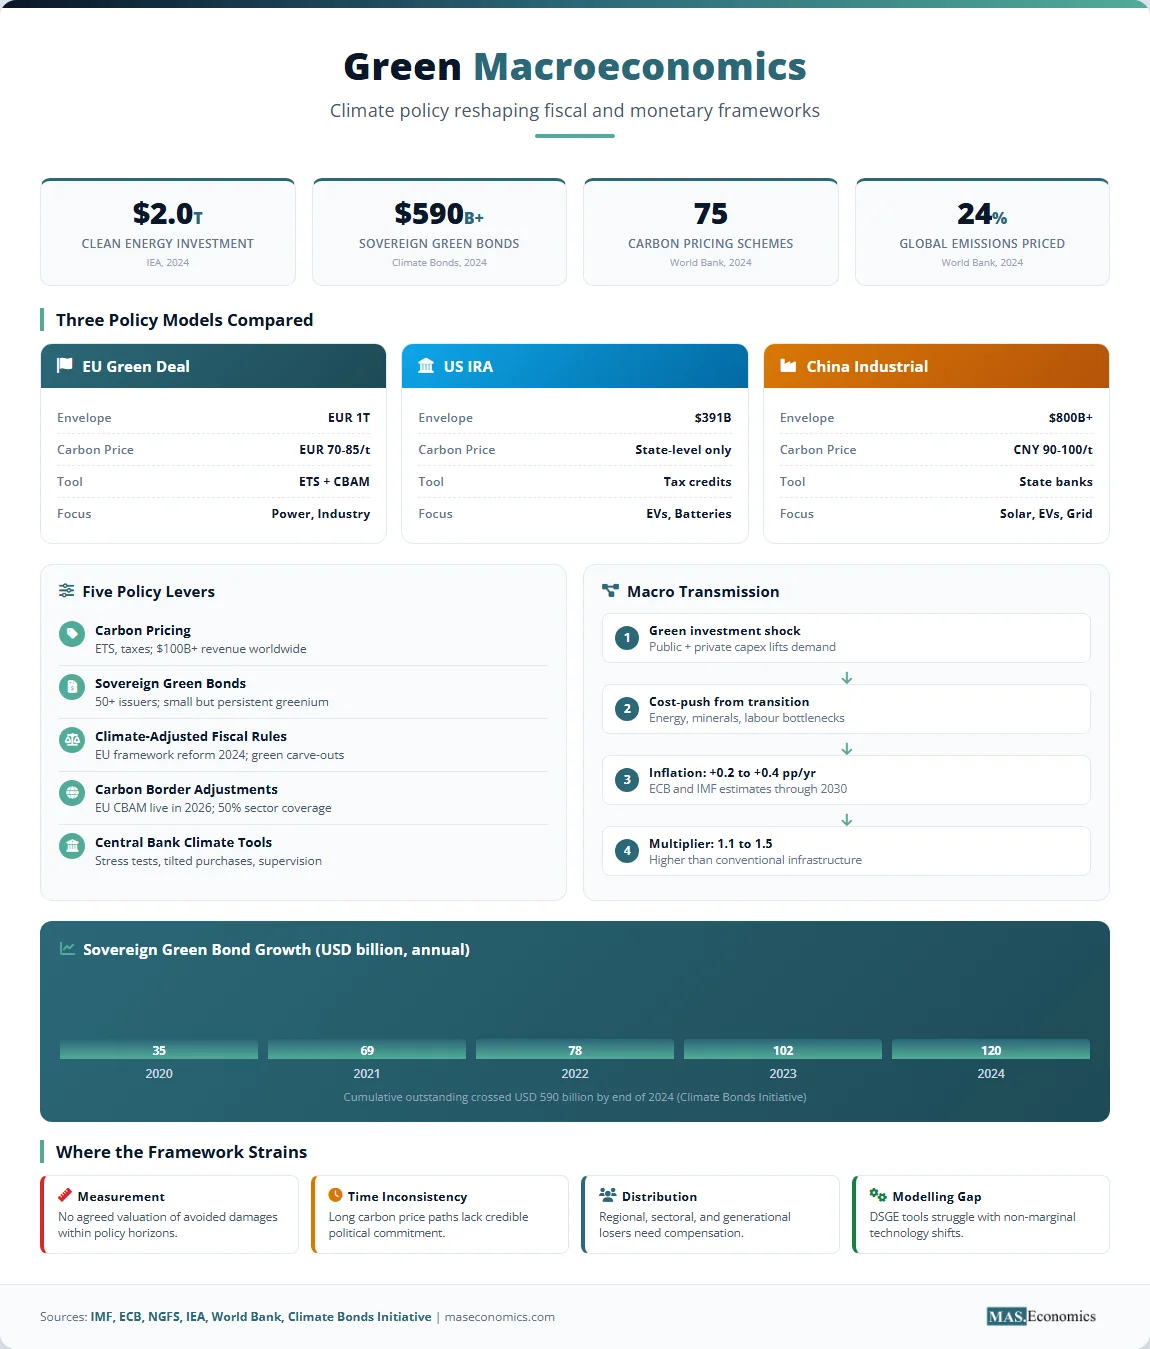
Carbon prices, green bonds, climate-adjusted debt rules, and border carbon adjustments are not side issues anymore. They sit inside the core machinery of the modern macroeconomy. Central banks publish climate stress tests. Finance ministries write green budgets. Sovereign green bond markets crossed USD 590 billion in cumulative issuance by 2024. The instruments and the language of policy are changing in lockstep.
This article maps that change. It explains what green macroeconomics covers, how the main policy levers work, what the empirical evidence shows about their macroeconomic effects, where the framework breaks, and why the field still struggles to settle the most basic questions about growth, inflation, and debt in a decarbonising world.
What Green Macroeconomics Means
Green macroeconomics studies how climate policy and the energy transition reshape aggregate demand, aggregate supply, prices, public debt, and financial stability. The label is recent, but the building blocks are familiar: externalities, fiscal multipliers, term structure of interest rates, balance sheet stress, and structural change. What is new is the scale of the shock and the speed at which governments and central banks have started to redesign their frameworks around it.
Three forces sit at the centre. The first is decarbonisation, which requires a managed shift away from fossil capital. The second is physical climate risk, which damages output and capital stock through floods, fires, droughts, and heat. The third is transition risk, which falls on financial assets when carbon-intensive firms lose value faster than expected. Each force has macroeconomic consequences. Each force changes how we should read inflation data, debt sustainability, and the neutral interest rate.
The Network for Greening the Financial System defines climate-related risks as a source of financial stability concern and macroeconomic disturbance, not a niche environmental topic. That framing has been adopted, with some variation, by the ECB, the Bank of England, the Banco Central do Brasil, and other supervisors. Climate is now a standing item in monetary policy strategy reviews, alongside the inflation target and the operational framework.
Carbon Pricing as Fiscal Tool
Carbon pricing is the workhorse instrument. It turns an externality into a market signal, and the revenue is fiscal. Two designs dominate. Emissions trading systems (ETS) cap total emissions and let firms trade allowances. Carbon taxes set a price per tonne of CO₂ and let quantities adjust. The World Bank Carbon Pricing Dashboard tracked 75 carbon pricing instruments worldwide in 2024, covering about 24 percent of global emissions and raising over USD 100 billion in revenue.
The EU Emissions Trading System is the largest. Its allowance price climbed from below EUR 10 per tonne in 2017 to above EUR 80 per tonne in 2024, with a peak near EUR 100 in early 2023. Sweden has the highest carbon tax in the world, above USD 130 per tonne in 2024, according to the OECD. Canada operates a federal benchmark price that rises by CAD 15 per tonne each year, scheduled to reach CAD 170 by 2030.
The macroeconomic logic is straightforward. A carbon price raises the cost of fossil fuel inputs, which works as a cost-push shock. It compresses the real wage in carbon-intensive sectors, redirects investment to lower-carbon technologies, and generates revenue. Households face higher energy bills, which is regressive without rebates. The IMF Fiscal Monitor recommends recycling at least one-third of carbon revenues into transfers for low-income households to keep the policy politically durable.
The empirical evidence on output effects is reassuring at moderate price levels. A 2020 IMF study using a panel of European countries found that a USD 10 per tonne increase in the effective carbon price reduces emissions by about 2 percent within five years, with no statistically significant effect on GDP growth at conventional confidence levels. Effects on inflation are small but visible. The ECB has estimated that the EU ETS contributed roughly 0.1 to 0.2 percentage points to euro area headline inflation in 2022 and 2023.
Sovereign Green Bond Growth
Green bonds finance projects with environmental benefits. The instrument was invented by the European Investment Bank in 2007. The first sovereign issue came from Poland in 2016. By the end of 2024, more than 50 countries had issued sovereign green bonds, with cumulative volumes above USD 590 billion according to the Climate Bonds Initiative. France, Germany, the United Kingdom, Italy, and Chile are the largest issuers.
The investor case rests on two arguments. Green bonds match the tenor of long-duration green projects, which suits insurers and pension funds. They also signal a credible commitment to the energy transition, which can lower the political cost of decarbonisation. The “greenium,” the spread between green and conventional bonds with similar terms, has been small but persistently negative, around 1 to 3 basis points in primary markets according to ECB and BIS research. The yield discount is real but modest, which limits how much green bonds can cut financing costs on their own.
The bigger contribution is institutional. Green bond frameworks force governments to disclose project-level climate spending, run independent reviews, and publish allocation reports. That discipline is harder to build inside a general budget process. For emerging markets, the green label has also opened access to a deeper, more diversified investor base, which is useful when domestic capital markets are thin.
Climate-Adjusted Fiscal Rules
Traditional fiscal rules cap the deficit and the debt ratio. They do not distinguish between borrowing for a road and borrowing for a solar farm with multi-decade returns. That bias is now widely recognised. The IMF, the European Fiscal Board, and the OECD have all proposed climate-adjusted variants that protect green public investment while keeping medium-term debt anchored.
The reformed EU economic governance framework, which entered into force in 2024, allows member states longer adjustment paths if they commit to qualifying green and digital investments. The United Kingdom’s Green Book guidance now requires climate impact assessment for major capital projects. Germany’s KfW operates a EUR 100 billion Climate and Transformation Fund that runs partly outside the regular debt brake.
The rationale uses a simple intertemporal point. Climate inaction raises the present value of future damages, which reduces the sustainable level of debt. Climate investment, if it lowers expected damages or speeds up productivity in low-carbon sectors, can raise that ceiling. The empirical question is whether public green spending earns enough social return to justify the borrowing. IMF working paper estimates put the multiplier on green public investment at 1.1 to 1.5 in advanced economies, higher than the multiplier on conventional infrastructure under most specifications.
How Carbon Borders Work
Carbon border adjustment mechanisms (CBAMs) tax the embedded carbon of imported goods to match the domestic carbon price. They aim to prevent carbon leakage, where production migrates to jurisdictions with weaker climate policy, and to keep domestic firms competitive. The EU CBAM entered its transitional phase in October 2023 and will become fully operational in 2026, covering cement, iron and steel, aluminium, fertilisers, electricity, and hydrogen.
The mechanics are intricate. Importers will buy CBAM certificates priced in line with the EU ETS allowance price. Exporters that have already paid a domestic carbon price can deduct it. The European Commission estimates the policy will cover about 50 percent of emissions in the targeted sectors, raising EUR 1 to 1.5 billion per year initially.
The macroeconomic implications are significant for trade-exposed economies. The IMF has flagged CBAM as a meaningful relative-price shock for countries that export carbon-intensive goods to Europe, including Türkiye, Russia, Ukraine, China, and several developing nations. India and South Africa have raised concerns at the WTO. The United States introduced its own legislative proposals, the Foreign Pollution Fee Act and the PROVE IT Act, which would build the data infrastructure for a future US carbon border policy.
CBAM also reshapes the political economy of trade policy. It blurs the line between climate and industrial policy, and it gives jurisdictions with credible carbon pricing a new way to project economic influence. That is a structural change in how trade rules interact with environmental rules.
Central Banks and Climate
Central banks have moved from a position of formal neutrality to one of explicit engagement with climate risk. The transition happened in three steps. First, supervisors recognised that climate change poses prudential risks to banks and insurers. Second, central banks ran climate stress tests and integrated climate into financial stability monitoring. Third, several central banks adjusted their own collateral frameworks and asset purchases to reflect climate risk.
The ECB conducted its first economy-wide climate stress test in 2021, covering more than four million firms and 1,600 banks. Results showed that euro area banks face material credit losses under disorderly transition scenarios, but that early action would lower these losses by about 60 percent compared to delayed action. The Bank of England ran a parallel exercise, the 2021 Climate Biennial Exploratory Scenario, with similar conclusions.
Monetary policy is more contested. A growing literature argues that climate change affects the natural rate of interest, the price level, and the trade-off between inflation and output that central banks navigate. Energy price shocks are larger and more frequent in a transitioning economy. Physical damage disrupts supply chains and food prices. Fossil fuel investment is falling faster than clean substitutes can scale, which creates intermittent capacity gaps. The ECB now refers to “climateflation” and “fossilflation” as distinct contributors to medium-term inflation pressures.
The hardest question is whether central banks should actively tilt their asset portfolios away from carbon-intensive issuers. The ECB began doing this for its corporate bond purchases in 2022, applying a “greenness score” to reinvestments. Critics argue this strays beyond the mandate. Supporters argue that ignoring climate risk is itself a policy choice with macroeconomic consequences.
Green Investment Demand Effect
Public and private green investment is large enough to register as a demand shock at the macro level. The International Energy Agency reports that global clean energy investment reached USD 2 trillion in 2024, up from USD 1.1 trillion in 2019. That is roughly twice the level of fossil fuel investment, which has stayed near USD 1 trillion. The shift is genuine and accelerating.
Green investment behaves like any other capital deepening shock. It raises aggregate demand in the short run, lifts demand for skilled labour and intermediate goods, and crowds in private investment when public spending de-risks new technologies. Estimates of the green multiplier vary by methodology. A 2022 Oxford Economics paper and a 2023 IMF working paper both find short-run multipliers above one in advanced economies, with stronger effects when monetary policy is accommodative.
Crowding out matters at the margin. When economies are at full employment and central banks are tightening, large green stimulus packages can lift real interest rates and pull resources from other sectors. The Inflation Reduction Act in the United States, with around USD 391 billion in energy and climate provisions over a decade, did contribute to construction wage pressures in 2023 and 2024. The effect on aggregate inflation, however, has been modest because the spending is spread over years and matched by productivity gains in clean manufacturing.
Transition Costs and Inflation
The energy transition has a cost-push component. Replacing fossil capital before the end of its economic life raises the average cost of energy in the medium term, even as long-run costs fall. Critical minerals lithium, copper, nickel, and cobalt face supply constraints that lifted prices sharply in 2021 and 2022. Permitting bottlenecks slow new transmission lines. Skilled labour for offshore wind and battery manufacturing remains scarce.
The ECB estimates that the green transition could add 0.2 to 0.4 percentage points to euro area inflation per year through 2030, depending on policy design and the pace of fossil phase-out. The IMF reaches a similar range. Emerging markets face larger pressures because their energy mix relies more heavily on coal, and their fiscal space for green subsidies is tighter.
Sticky services inflation interacts with the transition in subtle ways. Service prices respond slowly to commodity shocks but absorb wage pressure from green construction and retrofitting. That pushes the disinflation last mile higher and longer than a standard Phillips curve would predict.
Three Policy Models Compared
The European Union, the United States, and China have each built a distinct green macroeconomic framework. The EU leads on carbon pricing and regulatory standards. The United States leads on industrial subsidies and tax credits. China leads in manufacturing scale and state-directed investment. Each model produces different macroeconomic outcomes and different political vulnerabilities.
The table below compares the three approaches on five dimensions: headline spending, carbon price, sectoral focus, financing model, and trade policy stance.
| Dimension | EU Green Deal | US Inflation Reduction Act | China Green Industrial Policy |
|---|---|---|---|
| Headline spending (10-year envelope) | EUR 1 trillion (mixed public-private) | USD 391 billion (federal tax credits and grants) | Estimated USD 800 billion-plus (state banks and subsidies) |
| Effective carbon price (2024) | EUR 70-85 per tonne (EU ETS) | No federal price; state-level RGGI and California systems | National ETS at CNY 90-100 per tonne |
| Primary sectoral focus | Power, industry, buildings, transport | Clean manufacturing, EVs, batteries, hydrogen | Solar PV, EVs, batteries, grid infrastructure |
| Financing model | NextGenerationEU bonds, ETS revenue, member-state budgets | Federal deficit financing, refundable tax credits | State bank lending, local government bonds, direct subsidy |
| Trade policy stance | CBAM live; export controls on critical inputs | Domestic content requirements; selective tariffs | Export-oriented overcapacity; outbound FDI in green inputs |

|
|||
Table 1. Three models: A comparison of EU, US, and China climate policy frameworks.
The EU model relies on price signals plus regulation. It is administratively complex but gives carbon a market value across the economy. The US model uses tax credits to lower the cost of clean technology directly. It accepts a higher fiscal cost in exchange for political durability and supply chain resilience. The Chinese model concentrates investment through state banks and industrial policy. It produces enormous manufacturing scale but generates global overcapacity tensions, especially in solar panels, EVs, and batteries.
Sovereign Green Bond Issuance
Sovereign green bond issuance is one of the cleanest indicators of how seriously governments treat the transition. The chart below shows annual issuance by major sovereign issuers over the last five years.
Source: Climate Bonds Initiative, OECD, national debt management offices. Annual issuance in USD billion equivalent. 2024 data preliminary.
Two patterns stand out. France and Germany set the early benchmark, but the largest growth is in the “Other Sovereigns” group, which includes Chile, Indonesia, Egypt, Singapore, Thailand, Hong Kong, and others. Emerging markets are now the marginal source of issuance growth, even though their absolute volumes remain smaller than those of core European issuers. The total stock of outstanding sovereign green bonds has roughly tripled since 2020.
Where the Framework Breaks
Green macroeconomics still has unresolved problems. The first is measurement. There is no agreed methodology for valuing the macroeconomic benefit of avoided climate damages within a five- to ten-year policy horizon. Discount rates above 2 percent push most damages outside the relevant window, which biases analysis against early action. Discount rates below 1 percent generate present values that exceed plausible fiscal capacity.
The second problem is the credibility of long horizons. A carbon price path that rises gradually over thirty years requires a political commitment that no government can fully bind its successors to. Investors discount that uncertainty. The result is underinvestment in clean capital relative to the level a credible commitment would deliver. Climate-adjusted fiscal rules and independent climate councils try to address this, with mixed success.
The third problem is distributional. The transition redistributes income across regions, sectors, and generations. A coal-mining county loses tax revenue and jobs. A carbon-intensive exporter loses market share under CBAM. A pensioner on a fixed income absorbs higher energy bills. The political economy literature on stranded assets and just transition is large, but operational frameworks for compensation remain thin. The yellow vest protests in France in 2018 are the standard cautionary example.
The fourth problem is the modelling toolkit itself. Standard DSGE models assume smooth substitution between energy and capital. They struggle with non-marginal technology shifts, network effects in grid infrastructure, and tipping points in physical climate. Integrated assessment models address some of this but rely on parameter assumptions that drive results. The honest position is that we do not yet have a workhorse macro model that handles climate at the level of detail required for serious policy work.
MASEconomics Explains
4 economic concepts behind green macroeconomics
Conclusion
Green macroeconomics has moved from a research agenda into the operating manual of central banks and finance ministries. Carbon prices generate revenue and reshape relative prices. Green bonds finance long-duration projects and discipline budget transparency. Climate-adjusted fiscal rules try to protect investment without abandoning debt anchors. Border adjustments extend the reach of domestic carbon prices into trade. Central banks treat climate as a financial stability and price stability issue, not a values question.
The empirical record is uneven but informative. Carbon pricing reduces emissions with small output costs at moderate price levels. Sovereign green bonds carry a small but real yield premium for issuers. Green investment multipliers are above one. Transition costs add a measurable but manageable amount to inflation. The EU, US, and China have built three different policy models, each with its own strengths and political vulnerabilities. Each model is being tested in real time against measurable economic outcomes.
The unresolved problems are large. Measurement, time-inconsistent commitments, distribution, and modelling all need work. The questions that green macroeconomics is asking are harder than the questions standard macroeconomics was built to answer. The instruments and the data are improving year by year.
Did you find this article helpful? Share it with someone who loves economics. And remember, at MASEconomics, we make complex ideas simple.