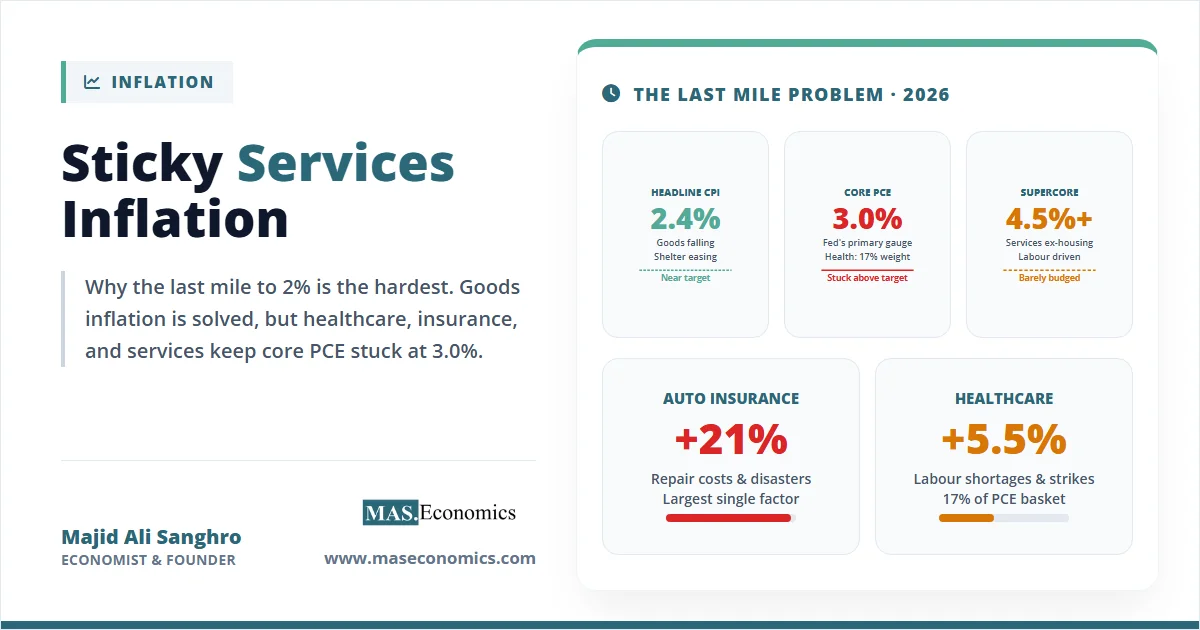
Goods inflation in the United States has been solved. By late 2025, the year-over-year change in durable goods prices had turned negative, supply chains had normalised, shipping costs had returned to pre-pandemic levels, and used car prices had fallen for 18 consecutive months. Energy prices stabilised. Food inflation decelerated to levels consistent with the Federal Reserve’s target. By every traditional measure, the inflation surge that began in 2021 should have been over. It was not. Core PCE, the Fed’s preferred inflation gauge, climbed to 3.0% in early 2026, the highest reading in over 18 months, at a time when headline CPI had already fallen to 2.4%. The culprit behind this divergence is sticky services inflation: the persistent, structurally driven price increases in healthcare, insurance, financial services, shelter, and transportation services that have proven almost entirely unresponsive to the 525 basis points of rate hikes the Fed delivered between 2022 and 2023.
The concept of sticky services inflation has moved from an academic curiosity to the central question in monetary policy. Fed Governor Michael Barr stated in February 2026 that it is “appropriate to hold rates steady for some time,” citing the risk that core inflation settles at a 3% floor rather than returning to the 2% target. The San Francisco Federal Reserve’s inflation decomposition data shows that “supercore” services, defined as services excluding energy and housing, now account for the overwhelming majority of the distance between current inflation and the Fed’s target. Understanding why service prices are sticky, which specific services are driving the persistence, and what this means for monetary policy is essential for anyone following the global economy in 2026.
What Makes Services Inflation “Sticky”?
The distinction between “flexible” and “sticky” prices is one of the most important in macroeconomics. The Federal Reserve Bank of Atlanta maintains a Sticky Price CPI index that tracks goods and services whose prices change infrequently. Gasoline prices change daily. Airline fares change hourly. But health insurance premiums change once a year. Rent adjustments happen when leases renew, typically every 12 months. Auto insurance is repriced semi-annually or annually. These services, which make up the majority of consumer spending, exhibit price stickiness: they adjust slowly upward and even more slowly downward.
The economic theory behind price stickiness has deep roots. New Keynesian models treat sticky prices as the central friction that gives monetary policy its real effects. If all prices adjusted instantly to changes in money supply or demand, monetary policy would have no impact on real output. It is precisely because prices (especially service prices) adjust slowly that interest rate changes affect employment, investment, and growth. The same stickiness that makes monetary policy effective also makes inflation harder to reduce: once service prices have risen, they resist falling even when the conditions that caused the initial increase have reversed.
Three structural features make services inflation particularly persistent in the current environment:
1. Labour intensity. Services are produced primarily by people, not machines. A hospital visit requires nurses, doctors, technicians, and administrators. A restaurant meal requires cooks, servers, and delivery drivers. An insurance policy requires underwriters, claims adjusters, and customer service representatives. When wages rise, service costs rise almost one-for-one, because labour represents 60 to 80% of total costs in most service industries. Goods prices, by contrast, are heavily influenced by commodity costs, shipping, and manufacturing efficiency, all of which have normalised.
2. Contractual lags. Many service prices are set by annual contracts: insurance premiums, rent agreements, tuition fees, subscription services, and healthcare plan pricing. Even when underlying cost pressures ease, the contractual price remains locked until the next renewal cycle. This creates a mechanical lag of 6 to 18 months between changes in economic conditions and changes in measured services inflation.
3. Regulatory and structural barriers. Healthcare pricing in the United States is shaped by insurance negotiations, government reimbursement rates (Medicare, Medicaid), and hospital market power, not by simple supply-and-demand dynamics. Auto insurance pricing reflects actuarial models that incorporate rising repair costs (due to more complex vehicle technology), legal settlement trends, and natural disaster frequency. These structural factors are largely immune to interest rate changes.
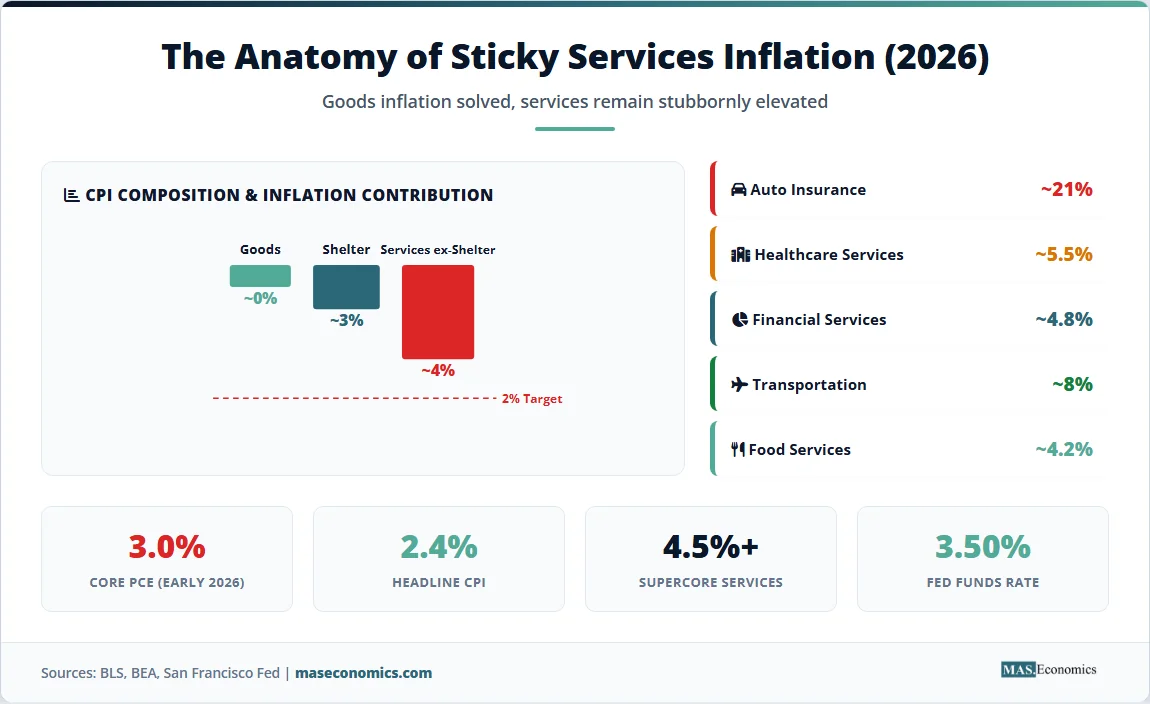
The Five Stickiest Categories
1. Auto Insurance: +21% Year-over-Year
Auto insurance has been the single largest contributor to sticky services inflation in 2025 and 2026. Premiums rose approximately 21% year-over-year, driven by a combination of factors that have nothing to do with monetary policy. Modern vehicles are more expensive to repair because they contain complex electronics, sensors, and cameras. The average cost of an auto body repair has increased significantly as parts have become more scarce and specialised. Legal settlement costs have risen. Natural disaster frequency (hurricanes, floods, wildfires) has increased claims volumes. Insurance companies, operating on annual pricing cycles, have passed these accumulated cost increases to consumers in large, discrete jumps.
2. Healthcare Services: +5.5% Year-over-Year
Healthcare represents approximately 17% of the PCE basket, far more than its weight in CPI (approximately 7%). This is why the PCE has diverged so sharply from CPI in 2026: the PCE captures the full cost of healthcare services, including third-party payments by insurers and government programmes, while CPI primarily captures out-of-pocket costs. Rising medical labour costs, driven by nationwide healthcare worker shortages and a series of strikes in 2025, have pushed hospital and physician services prices higher. These costs flow into the PCE through insurance premiums and government reimbursement rates with a lag of 6 to 12 months.
3. Financial Services and Insurance: +4.8% Year-over-Year
Financial services inflation includes banking fees, portfolio management fees, and insurance premiums beyond auto insurance (homeowners, renters, life). The PCE measures financial services partly through “imputed” costs, estimating the value of services that banks provide “free” in exchange for holding deposits at below-market interest rates. When interest rates are high, this imputed cost rises mechanically, contributing to measured inflation even without any visible price increase to consumers.
4. Transportation Services: +8% Year-over-Year
Airline fares, vehicle maintenance, and public transit costs have all remained elevated. Airline pricing reflects fuel costs, labour agreements (pilots received significant pay increases in 2023 to 2024 contracts), and strong travel demand. Vehicle maintenance costs reflect the same repair-cost dynamics driving auto insurance. Public transit systems, facing post-pandemic ridership shortfalls, have raised fares to compensate for reduced revenue.
5. Food Services and Accommodation: +4.2% Year-over-Year
Restaurant prices, hotel rates, and food-away-from-home costs remain sticky because they are driven primarily by wages and rent, both of which have been slow to moderate. The restaurant industry, which experienced severe labour shortages during the pandemic, raised wages significantly to attract workers. Those wage increases are now embedded in menu prices and are unlikely to reverse even as the broader labour market softens.
| Service Category | PCE Weight (%) | YoY Inflation (Early 2026) | Key Driver | Sensitivity to Rate Hikes |
|---|---|---|---|---|
| Auto insurance | ~3.5% | ~21% | Repair costs, natural disasters, legal settlements | Very low |
| Healthcare services | ~17% | ~5.5% | Labour shortages, insurance repricing | Very low |
| Financial services & insurance | ~8% | ~4.8% | Imputed costs rise with interest rates | Perversely positive |
| Transportation services | ~4% | ~8% | Pilot wages, repair costs, fuel | Low to moderate |
| Food services & accommodation | ~7% | ~4.2% | Wages, rent, input costs | Moderate |

|
||||
The CPI-PCE Divergence
One of the most disorienting features of the 2025 to 2026 inflation landscape is the growing gap between CPI and PCE. In early 2026, headline CPI had fallen to 2.4% while core PCE remained at 3.0%. For non-specialists, this divergence creates confusion: is inflation almost conquered, or still dangerously elevated?
The answer depends on which prices you weight most heavily. The CPI gives shelter (rent and owners’ equivalent rent) a weight of approximately 34%. Shelter costs, which lagged the broader market by 12 to 18 months, began declining in late 2025 as new apartment supply came online and rent growth moderated. This decline in shelter pulled the CPI down significantly.
The PCE, by contrast, gives housing a weight of only about 15%. It gives healthcare approximately 17% and financial services approximately 8%. These are precisely the categories where inflation has been most persistent. The result: the same economy produces two very different inflation readings depending on which consumption basket you use.
The Federal Reserve has explicitly stated that it targets PCE inflation, not CPI. This means the sticky services categories that dominate the PCE basket are the ones that matter most for interest rate decisions. Until healthcare, insurance, and financial services inflation moderates, the Fed is unlikely to resume aggressive rate cutting, regardless of how much the CPI falls.
Supercore: The Metric That Now Runs Monetary Policy
“Supercore” inflation, defined as core services excluding housing and energy, has become the single most important inflation metric for the Federal Reserve. Fed Chair Powell began referencing supercore explicitly in late 2022, and by 2024, it had become the primary lens through which FOMC members evaluated progress toward the 2% target.
The logic is straightforward. Goods inflation has normalised and provides no information about underlying inflationary pressure. Energy prices are volatile and driven by geopolitical factors outside the Fed’s control. Shelter inflation is a lagging indicator that reflects rent agreements signed 12 to 18 months earlier, not current market conditions. What remains after excluding all three categories is the supercore: healthcare, financial services, insurance, food services, transportation services, and other services. These categories are driven primarily by domestic labour costs and are the ones most sensitive (in theory) to the Fed’s management of aggregate demand through interest rate policy.
In practice, however, supercore has been stubbornly resistant. The San Francisco Fed’s data shows that supercore PCE remained above 4% through late 2025 and into 2026, even as headline inflation fell. The January 2026 supercore print jumped 0.6% in a single month, fuelled by a 6.5% surge in airline fares and rising medical costs. This acceleration, at a time when goods prices were falling, and shelter was moderating, represents precisely the kind of embedded services inflation that monetary policy struggles to address.
Why Interest Rates Struggle to Fix Services Inflation
The conventional monetary policy transmission mechanism works through credit channels. Higher interest rates increase the cost of borrowing, which reduces investment, housing construction, and consumer spending on durable goods (cars, appliances, electronics). This reduces demand for goods and housing, pushing those prices down.
Services inflation operates through a different channel: the labour market. Service prices are set primarily by wages, and wages are set by labour market tightness. In theory, higher interest rates should eventually soften the labour market by reducing business investment and hiring, which would moderate wage growth and, eventually, service prices. But this transmission takes much longer (18 to 36 months) and requires significantly more economic pain than cooling goods prices.
There is an additional paradox specific to the current cycle. Several categories of services inflation are actually worsened by higher interest rates. Financial services inflation includes imputed banking costs that rise mechanically with interest rates. Homeowners insurance rises when replacement costs (driven partly by building material costs and higher construction financing rates) increase. Auto insurance reflects higher vehicle prices, which are partly a function of higher financing costs discouraging trade-ins and keeping older, more accident-prone vehicles on the road.
This creates a monetary policy trap: the tool designed to reduce inflation is, in certain service categories, contributing to the very inflation it is meant to suppress. The lags in monetary policy transmission mean that the Fed must calibrate between fighting services inflation (which requires a tighter policy for longer) and avoiding unnecessary damage to the goods and housing sectors (which have already cooled significantly).
The “3D Reset” and Structural Persistence
Several analysts have argued that sticky services inflation is not merely cyclical but reflects deeper structural forces that some have labelled the “3D Reset”: Demographics, Deglobalization, and Decarbonization.
Demographics: Ageing populations across advanced economies are shrinking the labour force while increasing demand for healthcare, elder care, and personal services. This structural tightness in the services labour market puts permanent upward pressure on wages in precisely the sectors driving supercore inflation.
Deglobalisation: While goods can be sourced globally (and goods prices benefit from globalisation), services are overwhelmingly produced domestically. A haircut, a doctor’s visit, and a restaurant meal cannot be outsourced to a lower-cost country. As friendshoring and reshoring raise the cost of manufactured inputs, these costs eventually flow into service prices through higher rents, higher logistics costs, and more expensive domestic supply chains.
Decarbonisation: The energy transition increases costs in the medium term as economies invest in new infrastructure, retrofit buildings, and comply with tighter environmental regulations. These costs are particularly concentrated in services: construction, transportation, utilities, and government services.
If the 3D Reset thesis is correct, the implication is that the Fed’s 2% inflation target may be structurally harder to achieve than it was during the 2010s, when demographics, globalisation, and cheap energy all suppressed service costs simultaneously. The pre-pandemic “lowflation” era may have been the anomaly, not the norm.
Source: BLS, BEA, San Francisco Federal Reserve inflation decomposition data | MASEconomics.com
The chart reveals the core story of the 2023 to 2026 inflation cycle. Headline CPI (green line) has fallen dramatically from 6.4% to 2.4%, driven by the normalisation of goods and energy prices. Core PCE (red line) has been far stickier, hovering between 2.7% and 3.0% for more than a year. And supercore services (dashed amber line) have barely moved at all, remaining above 4% throughout the entire period. The growing gap between the green and amber lines represents the “last mile” problem: the distance between where headline inflation has reached and where the underlying services pressure actually sits. Until the amber line converges toward 2%, the Fed’s job is not done.
Is Sticky Services Inflation a US Problem?
Sticky services inflation is not unique to the United States, but it manifests differently across economies. In the United Kingdom, services CPI remained above 5% through much of 2025, driven by wage growth in hospitality, healthcare, and education, keeping the Bank of England cautious about cutting rates despite falling headline inflation. The eurozone faced similar dynamics, with services inflation running persistently above goods inflation and complicating the ECB’s rate path.
Japan represents the inverse case. After three decades of deflationary pressure, Japan has finally achieved positive services inflation, driven by the largest wage increases in 30 years. For the Bank of Japan, services inflation is a goal rather than a problem, and its emergence has been celebrated as evidence that the economy is finally escaping the deflationary trap.
The common thread across all advanced economies is the labour intensity of services and the tightness of service labour markets. Demographic trends (ageing populations, lower labour force participation among younger cohorts) are making services workers structurally scarce, putting permanent upward pressure on wages and, through wages, on the prices of labour-intensive services.
MASEconomics Explains
Four concepts behind sticky services inflation
Sticky Prices
Prices that adjust infrequently, such as insurance premiums (annual), rents (lease-based), and healthcare costs (contract-based). The Atlanta Fed’s Sticky Price CPI tracks these items separately. In New Keynesian models, price stickiness is the central friction that gives monetary policy its real-world effects.
Supercore Inflation
Core services excluding housing and energy, the purest measure of domestic demand-driven inflation. The Federal Reserve tracks supercore as its preferred indicator of underlying price pressure because it strips out volatile components (energy), lagging indicators (shelter), and globally determined prices (goods).
PCE vs. CPI Divergence
The CPI weights shelter at 34% of the basket; the PCE weights it at 15%. The PCE weights healthcare at 17%; the CPI at 7%. These weighting differences mean the same economy produces different inflation readings. The Fed targets PCE, which is currently higher than CPI because healthcare and insurance remain elevated.
Wage-Price Persistence
The mechanism by which wage increases in labour-intensive service sectors translate into higher services prices, which in turn support further wage demands. Unlike goods inflation (driven by supply chains and commodities), services inflation is overwhelmingly a function of labour costs, making it slower to build and slower to unwind.
Conclusion
Sticky services inflation is the defining challenge of the post-pandemic monetary policy cycle. Goods inflation has normalised. Energy prices have stabilised. Shelter inflation has begun to moderate as new supply enters the market. What remains is a core of services price pressure, concentrated in healthcare, insurance, financial services, transportation, and food services, that has proven largely impervious to the most aggressive rate-hiking cycle in four decades. Core PCE at 3.0% and supercore services above 4% in early 2026 confirm that the “last mile” to the Fed’s 2% target is not a mile at all; it is the structural residue of labour market tightness, demographic change, and sector-specific cost dynamics that monetary policy alone may not resolve.
The CPI-PCE divergence underscores how different measurement frameworks can produce radically different assessments of inflation progress. Headline CPI at 2.4% suggests the fight is nearly won. Core PCE at 3.0% suggests it is stalled. For the Federal Reserve, which targets PCE, the relevant measure is the one that paints the more stubborn picture. Until supercore services inflation breaks below 3%, rate cuts will remain cautious, and the “higher for longer” stance will persist.
The structural forces behind sticky services inflation, demographics, deglobalisation, decarbonisation, and the inherent labour intensity of the services economy suggest that the pre-pandemic era of sub-2% services inflation may not return. The 2% target, designed in an era of abundant labour and cheap globalised supply chains, may need to be reconsidered if service costs prove permanently elevated. Whether the Fed adjusts the target, tolerates a modest overshoot, or maintains restrictive policy until something breaks in the labour market is the central question in macroeconomics heading into the second half of 2026.
Did you find this article helpful? Share it with someone who loves economics. And remember, at MASEconomics, we make complex ideas simple.