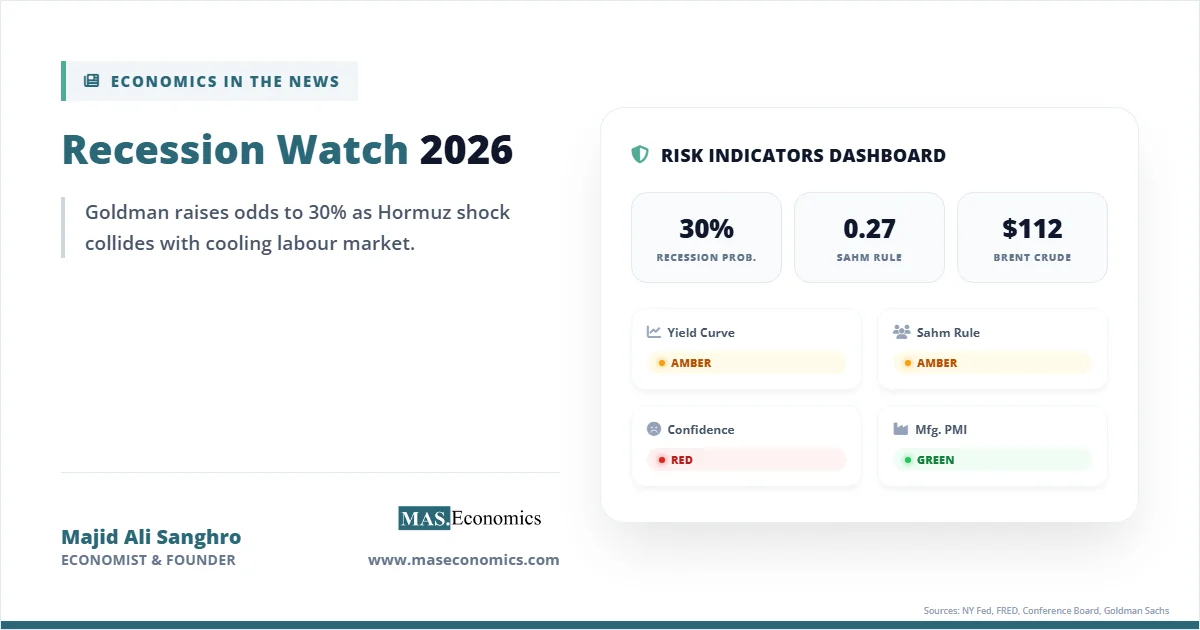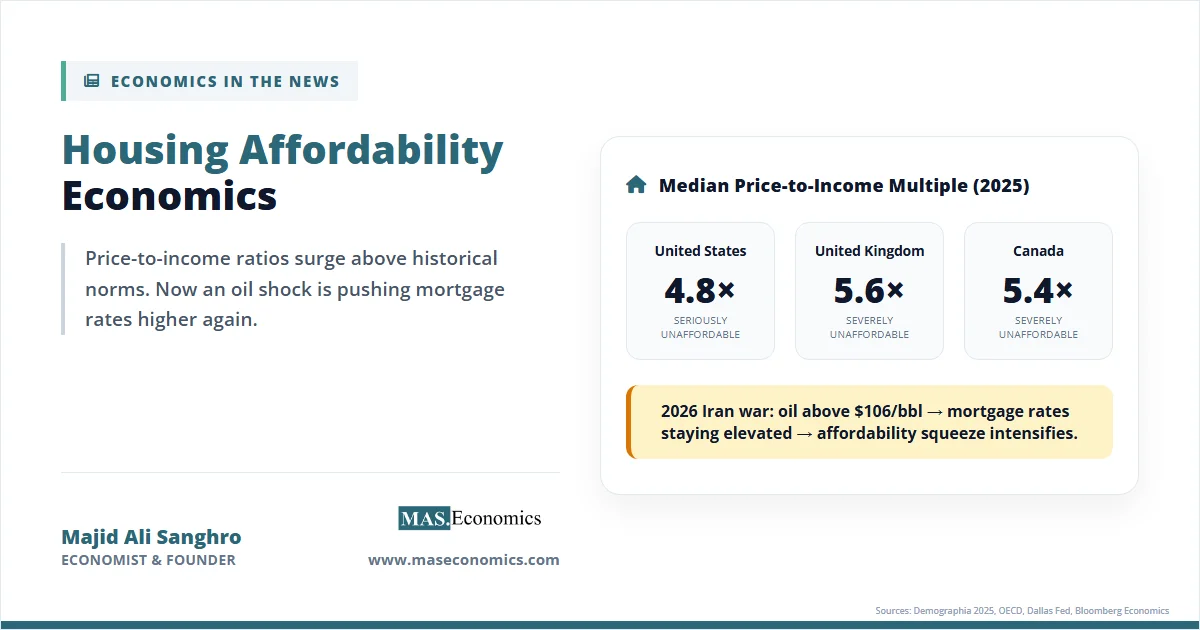
Housing affordability economics has moved from a slow-burning policy concern to the sharpest pressure point in household budgets across the US, UK, and Canada. For three decades, home prices have pulled away from incomes in every major metropolitan area. The 2025 Demographia survey now shows the median US home at 4.8 times median household income, the UK at 5.6, and Canada at 5.4. Each of these numbers sits firmly in what Demographia classifies as “seriously” to “severely” unaffordable, far above the historical benchmark of 3.0 that held through the early 1990s. Vancouver, at a median multiple of 11.8, is now the fourth least affordable market on earth, and Sydney, at 13.8, sits second only to Hong Kong.
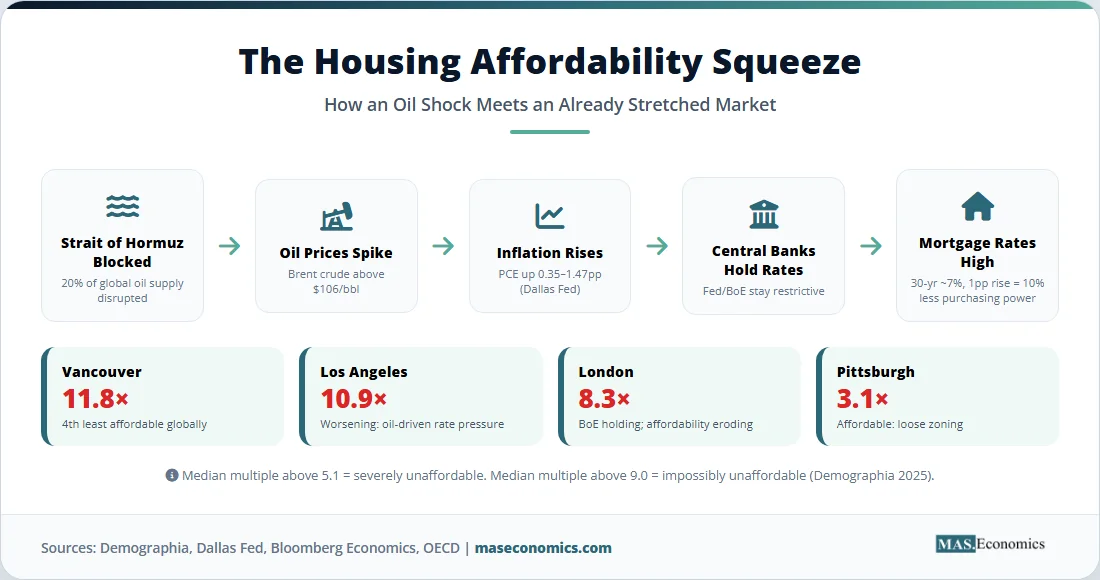
That gap did not open in a calm decade. It opened against recurring shocks, and the latest one is reshaping the affordability math in real time. Since late February 2026, the war between Iran and the US-Israel coalition and Iran’s blockade of the Strait of Hormuz have removed roughly 20% of global oil supplies from reliable shipping. Brent crude pushed above $106 per barrel by late April 2026. The Dallas Fed’s baseline model estimates that a prolonged closure could lift US headline PCE inflation by between 0.35 and 1.47 percentage points by year end. For housing, the transmission line is direct: oil shock becomes inflation, inflation forces central banks to hold rates higher for longer, and higher rates collide with already-stretched price-to-income ratios to produce the worst entry conditions for first-time buyers in a generation.
How We Got Here
The long arc of the affordability problem begins in the 1990s. Before that decade, median home prices in most anglophone markets hovered at two to three times median household income, close to the historical norm. From the mid-1990s onward, four forces began pulling prices away from the income line at the same time. Land-use regulation tightened in coastal California, metropolitan Vancouver, Greater Toronto, and the English home counties. Mortgage credit expanded through securitization, pulling demand forward. Real interest rates fell through the 2000s and 2010s. And institutional investors moved into single-family rental portfolios after 2012, especially in US Sun Belt metros.
The 2020–2022 pandemic period accelerated the divergence into something qualitatively new. Emergency monetary policy pushed the US 30-year mortgage rate to a floor of roughly 2.65% in early 2021. Homebuyers capitalized on cheap credit into price, and remote work freed demand from commute sheds, flooding mid-sized cities with priced-out buyers from the coasts. Between Q1 2020 and Q2 2022, the US Case-Shiller National Home Price Index rose about 40%, UK house prices rose roughly 25%, and Canadian national prices rose over 50%. Incomes did not rise anywhere close to that pace.
Then the inflation cycle broke the financing side. The Fed’s tightening campaign from March 2022 onward pushed the US 30-year fixed mortgage rate above 7% through 2023 and into 2024. Analysts at Capital Economics now expect the average 30-year rate to hover around 7% through much of 2025 and not dip to 6% until the end of 2026. The Bank of England held the bank rate elevated through 2024, and Canada’s five-year fixed rates stayed materially above their pre-pandemic base. Homeowners who locked in 3% rates refused to list, producing the now-famous “lock-in effect” that collapsed resale supply even as demand cooled.
The 2026 Iran war is the latest shock layered on top of this already-fragile equilibrium. Shipping traffic through the Strait of Hormuz has been largely blocked since 28 February 2026, when the US and Israel launched air operations against Iran. The International Energy Agency has called the resulting disruption the “largest supply disruption in the history of the global oil market”. Even the ceasefire announced on 8 April did not restore normal ship traffic. OPEC+ pledged an additional 206,000 barrels per day to help fill the gap, but the pledge has not closed the gap. Readers who want the full mechanics of how oil supply disruptions transmit into inflation can find the detailed treatment in our piece on oil price shocks, and the geopolitical dimension in our analysis of the Strait of Hormuz chokepoint.
The Economics Driving the Squeeze
To understand why housing affordability economics has become so unforgiving, start with a model every first-year student learns: supply and demand, but with one important twist. Housing supply is unusually inelastic in the short run. New construction takes years. Permitted land is constrained by zoning. Existing homeowners, who sit on the largest stock of potential supply, choose whether to list based on their own financial calculus rather than market-clearing prices. Low short-run elasticity of supply means that when demand shocks arrive, prices absorb most of the adjustment rather than quantities.
The demand side has been pushed outward by three distinct forces. First, demographic bulge. US millennials reached peak homebuying age during the pandemic, meeting a housing stock built for a smaller population. Second, investor entry. Single-family rental operators and build-to-rent funds now account for roughly a quarter of starter-home purchases in several Sun Belt metros. Third, remote work relocations have permanently increased willingness-to-pay for space in secondary markets. Each demand shift met a supply curve that could barely move.
Supply constraints have deeper structural roots. Land-use regulation, as economists from Edward Glaeser to Joseph Gyourko have documented for two decades, is the dominant explanation for why Los Angeles and London have median multiples above 8 while Houston and Cleveland stay close to 3.5. Restrictive zoning creates what economists call a regulatory wedge: the market price of housing rises far above the marginal cost of construction. Those gaps are rents captured by existing owners rather than producer surplus reinvested in new supply. Construction input costs add a second layer. Lumber, steel, cement, and transport all have heavy energy content, and each leg of the 2022 and 2026 oil price spikes has pushed construction cost indices higher.
The third economic channel is monetary policy. Mortgages are the main intermediation technology in housing, so the price of credit is almost as important as the price of the house itself. When a central bank raises its policy rate, the 30-year mortgage rate follows the 10-year Treasury yield, and monthly payments on a given loan size rise sharply. Mortgage Sandbox estimates that a one-percentage-point increase in the mortgage rate lowers purchasing power by roughly 10% for a given monthly payment. That is the hidden lever the Iran shock is pulling. Higher oil prices feed through CPI and PCE. Central banks respond by staying restrictive. Mortgage rates stay elevated. Affordability compresses further. For the mechanics of how each of these policy decisions is made, see our analyses of central bank interest rate decisions and inflation reports explained.
Kilian, Plante, Richter, and Zhou, writing for the Dallas Fed in April 2026, estimate the transmission in explicit terms. Closing the Strait for one, two, or three quarters would lift Q4/Q4 headline PCE inflation in 2026 by 0.35, 0.79, and 1.47 percentage points, respectively. Core inflation moves by 0.1 to 0.5 percentage points. Bloomberg Economics runs a parallel scenario: at $170-per-barrel Brent, the impact on inflation and growth roughly doubles relative to the $110 baseline. Central banks that were hoping to deliver rate cuts in 2026 now face a stagflationary setup in which cuts would stoke further inflation. For housing buyers, that means the rate-driven path to affordability relief has been delayed again.
By the Numbers
The chart below shows the central fact of modern housing affordability economics. Over three decades, median home prices in the US, UK, and Canada have grown several times faster than median household incomes. The gap is not small, and it is not mostly cyclical.
Source: OECD House Price Indicators; US Census Bureau; UK ONS; Statistics Canada. Indexed to 1995 = 100, nominal.
The table below pulls current affordability metrics together for the most-watched markets in the three countries. The median multiple column is the price-to-income ratio, where a value above 5.1 is classified as “severely unaffordable” and above 9.0 as “impossibly unaffordable”. The mortgage-to-income column captures how much of gross household income is absorbed by the monthly mortgage payment at prevailing 2026 rates on a median-priced home with a 20% down payment.
| City | Country | Median Multiple (Q3 2024) | Mortgage-to-Income Share | Direction in 2026 |
|---|---|---|---|---|
| Vancouver | Canada | 11.8 | ~78% | Marginal improvement; prices softening |
| Toronto | Canada | 9.3 | ~62% | Improving on lower BoC rate; resale weak |
| Los Angeles | US | 10.9 | ~55% | Worsening on oil-driven rate pressure |
| San Jose | US | 11.9 | ~58% | Impossibly unaffordable; static |
| New York Metro | US | 7.1 | ~48% | Flat; rates the binding constraint |
| London | UK | 8.3 | ~51% | Worsening on BoE holding rates |
| Manchester | UK | 5.8 | ~38% | Holding; wage growth offsetting |
| Edmonton | Canada | 3.7 | ~28% | Best in Canada; moderately unaffordable |
| Pittsburgh | US | 3.1 | ~22% | Affordable; loosely zoned |
 | ||||
Sources: Demographia International Housing Affordability 2025 edition; National Bank of Canada Housing Affordability Monitor (Q4 2025); OECD housing indicators database. Mortgage-to-income shares assume 20% down payment and prevailing Q1 2026 fixed rates in each market.
Three patterns jump out. First, the cities with the tightest land-use regulation sit at the top of the unaffordability ranking, confirming the Glaeser-Gyourko finding. Second, the cities with the loosest zoning, Edmonton and Pittsburgh, are the only ones near the historical affordability threshold. Third, the current 2026 trajectory column shows how the oil-inflation-rates channel is asymmetric: markets where central banks are still holding or hiking (UK, US coastal) are worsening, while markets where cuts arrived earlier (Toronto, Vancouver) are seeing modest improvement.
What Policymakers Are Doing
The policy response has converged on three levers, each constrained by the oil shock. The first is supply-side zoning reform. Auckland, Minneapolis, and parts of California have moved to permit missing-middle density. Canada’s federal Housing Accelerator Fund ties infrastructure transfers to upzoning. The UK’s 2024 National Planning Policy Framework revisions similarly push local authorities toward higher build-out targets. These reforms take years to translate into completions, and rising energy-driven construction costs are eroding the margins on new builds even before they break ground.
The second lever is demand-side support: first-time buyer programs, shared-equity schemes, and mortgage insurance reforms. These tools move marginal buyers into homeownership without changing the underlying price-to-income ratio, which means they often raise prices at the entry segment rather than expand access. The third lever is monetary, and it is the most constrained in 2026. The Bank of Canada has already delivered cuts. The Fed and ECB are caught between oil-driven inflation and a weakening labor market. Morgan Stanley strategists see the US 30-year mortgage rate dropping to roughly 5.50% to 5.75% by mid-2026, then rising again in the second half. That narrow window, if it opens at all, is what separates the current cycle from a more prolonged affordability winter.
MASEconomics Explains
Four economic concepts behind housing affordability
Conclusion
Housing affordability economics in 2026 is the story of a three-decade structural gap hitting a fresh supply shock at exactly the wrong moment. Median home prices in the US, UK, and Canada have grown far faster than incomes since the mid-1990s, driven by restrictive zoning, expanding credit, institutional demand, and a pandemic-era monetary policy stance. The 2026 Iran war and the blockade of the Strait of Hormuz have now injected a classic oil-price shock into an already-strained housing system. Higher energy prices push inflation higher, central banks hold rates elevated, and mortgage costs stay pinned above the levels at which meaningful affordability relief becomes possible. The structural problem is a supply problem, solvable only over the years through zoning reform and sustained construction. The cyclical problem is a rates problem, and until the oil shock fades, the rates problem will keep blocking the cyclical exit.
Did you find this article helpful? Share it with someone who loves economics. And remember, at MASEconomics, we make complex ideas simple.