The Laffer Curve economics framework proposes something that sounds paradoxical: at high enough tax rates, cutting taxes can increase government revenue. Drawn on a napkin by economist Arthur Laffer in 1974 during a Washington dinner with Dick Cheney and Donald Rumsfeld, the curve became the intellectual cornerstone of supply-side economics and the Reagan tax cuts of 1981. Four decades later, it remains the most politically charged diagram in economics, cited approvingly by every advocate of tax reduction and dismissed derisively by every critic of it. The curve itself is analytically trivial. What makes it contested is the question of where, precisely, any given economy sits on it, and whether policymakers can identify the peak before damage is done.
The Napkin That Reshaped Fiscal Policy
The logic behind the Laffer Curve is disarmingly simple. At a zero tax rate, the government collects no revenue. At a 100% tax rate, no one has any incentive to earn taxable income, so the government again collects nothing. Somewhere between these two endpoints lies a rate that maximises revenue. Push rates below that peak, and cuts will reduce revenue. Push rates above it and cuts will raise revenue because the economic activity unleashed more than compensates for the lower rate applied to each dollar of income.
Laffer himself never claimed the insight was original. The underlying idea appears in the writings of the fourteenth-century Arab historian Ibn Khaldun, in the analytical work of John Maynard Keynes, and in the public finance tradition stretching back to Adam Smith. What Laffer contributed was a compelling visual shorthand at exactly the moment American policymakers were searching for a theoretical justification to cut taxes. The economic stagflation of the 1970s had discredited simple Keynesian demand management, and the top US federal marginal income tax rate stood at 70%. Laffer’s curve offered a promise with enormous political appeal: tax cuts need not come at the cost of larger deficits, because the tax base would expand sufficiently to offset the rate reduction.
The question the curve raises is genuinely important for fiscal policy design. Every tax system faces a fundamental tension between revenue needs and the distortions that taxation creates. If the government could identify the peak of the curve, it would know the maximum revenue it could extract without destroying the tax base itself. The problem, as five decades of research have shown, is that locating the peak empirically is vastly harder than drawing the curve theoretically.
The Mathematics Behind the Curve
The Laffer Curve can be formalised compactly. Let \( t \) denote the tax rate and \( B(t) \) the taxable base, which depends on the tax rate through behavioural responses. Total tax revenue \( R(t) \) is simply the product:
If the tax base were fixed regardless of the rate, revenue would rise linearly with \( t \). But raising \( t \) discourages work, investment, and reported income. The base \( B(t) \) therefore shrinks as \( t \) rises. Taking the derivative with respect to \( t \) and setting it to zero gives the revenue-maximising rate:
Rearranging yields:
This expression is more usefully rewritten using the elasticity of taxable income, denoted \( e \), which measures the percentage change in the tax base in response to a one percent change in the net-of-tax rate \( (1-t) \):
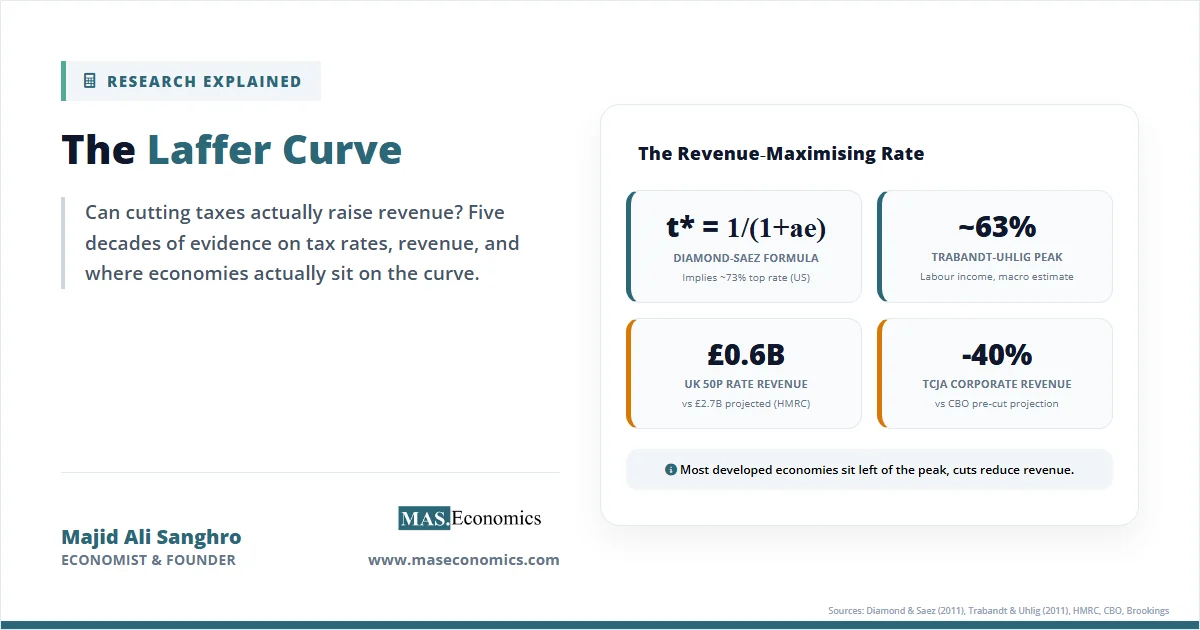
Applying this definition to the first-order condition yields the now-standard formula for the revenue-maximising top marginal tax rate, popularised by Peter Diamond and Emmanuel Saez in their 2011 Journal of Economic Perspectives paper:
Here \( a \) is the Pareto parameter of the upper tail of the income distribution, typically estimated at around 1.5 in the United States. The parameter \( e \) is the elasticity of taxable income with respect to the net-of-tax rate. Everything hinges on the value of \( e \). A low elasticity means taxpayers barely adjust their behaviour when rates change, and the revenue-maximising rate is high. A high elasticity means even modest rate increases trigger large reductions in reported income, pushing the peak of the curve down.

The table below summarises the variables in this framework.
| Symbol | Variable | Economic Meaning |
|---|---|---|
| \( t \) | Tax rate | The marginal rate applied to taxable income in the relevant bracket. |
| \( B(t) \) | Taxable base | The amount of income reported as taxable, which depends on \( t \) through behavioural responses. |
| \( R(t) \) | Tax revenue | Total revenue collected, equal to \( t \cdot B(t) \). |
| \( e \) | Elasticity of taxable income (ETI) | The percentage change in reported taxable income for a one percent change in the net-of-tax rate \( (1-t) \). |
| \( a \) | Pareto parameter | A measure of income concentration at the top of the distribution; smaller values indicate thicker tails. |
| \( t^* \) | Revenue-maximising tax rate | The rate at which \( dR/dt = 0 \); the peak of the Laffer Curve. |
| \( (1-t) \) | Net-of-tax rate | The share of an additional dollar of income a taxpayer keeps after tax. |
 | ||
Table 1. Laffer Curve Variables: Symbols and Economic Interpretations.
Two features of this framework deserve emphasis. First, the curve need not be symmetric. Empirical work consistently finds that it is skewed, with the peak typically above 50%, not at the intuitive midpoint. Second, there is not one Laffer Curve but many. The curve for labour income taxation differs from the curve for capital income taxation, which differs again from the curve for corporate or consumption taxes. Conflating these, as political rhetoric often does, is the source of much confusion.
What the Model Takes for Granted
The Laffer framework rests on assumptions that determine both its elegance and its limits. It assumes a single, well-defined tax rate rather than a complex schedule with brackets, deductions, credits, and exemptions. It assumes taxpayer behaviour can be captured by a single elasticity parameter that is stable across time and contexts. It abstracts from the composition of government spending, treating revenue as the sole policy objective rather than one input into broader welfare considerations.
The assumption of a stable elasticity is particularly fragile. Saez, Slemrod, and Giertz reviewed the empirical literature in 2012 and found elasticity estimates ranging from roughly 0.12 to 0.40 for high-income earners in the United States, with considerable variation across time periods and identification strategies. The elasticity reflects not a single behavioural margin but a bundle of responses: labour supply adjustments, tax avoidance through reclassification of income, migration across jurisdictions, retirement timing, and outright evasion. Each margin has its own elasticity, and each varies with the structure of the tax system. A system with many deductions and loopholes produces a higher effective elasticity than a system with a broad base and few escape routes.
The framework also abstracts from dynamic effects on capital accumulation and growth. In the short run, raising capital taxes may collect substantial revenue because the capital stock is fixed. In the long run, reduced investment shrinks the base. Trabandt and Uhlig’s 2011 analysis in the Journal of Monetary Economics showed that the Laffer Curve for capital income is considerably flatter than the curve for labour income, and that transition dynamics matter greatly: a surprise increase in capital taxes can raise revenue temporarily even when the long-run rate is above the steady-state peak. Finally, the model ignores equity entirely. Maximising revenue and maximising welfare are different problems, and a society may rationally choose rates below the revenue-maximising peak because the distortions at high rates are judged too costly even when revenue is still rising.
Does the Curve Survive the Data?
Empirical tests of the Laffer Curve have accumulated for four decades, and the central findings are now reasonably settled. The curve exists in the sense that revenue does eventually fall at very high rates. But most developed economies operate on the upward-sloping portion, well below the peak. This means that tax cuts generally reduce revenue rather than increase it, and tax increases generally raise revenue rather than reduce it.
The Diamond and Saez analysis, using sufficient-statistic methods with a Pareto parameter of 1.5 and an elasticity of 0.25, implies a revenue-maximising top federal marginal rate of roughly 73% for the United States when combined with state and payroll taxes. A more recent 2026 analysis by David Splinter, using a mid-range elasticity of 0.40 and detailed tax calculators, suggests the curve is flatter than the sufficient-statistic approach indicates and that top rates closer to the mid-60s may be near the peak once state and local taxes are considered. Trabandt and Uhlig’s macroeconomic analysis placed the US labour-tax peak around 63% and the EU-14 peak slightly higher, with both regions operating to the left of the peak, meaning higher rates would raise more revenue.
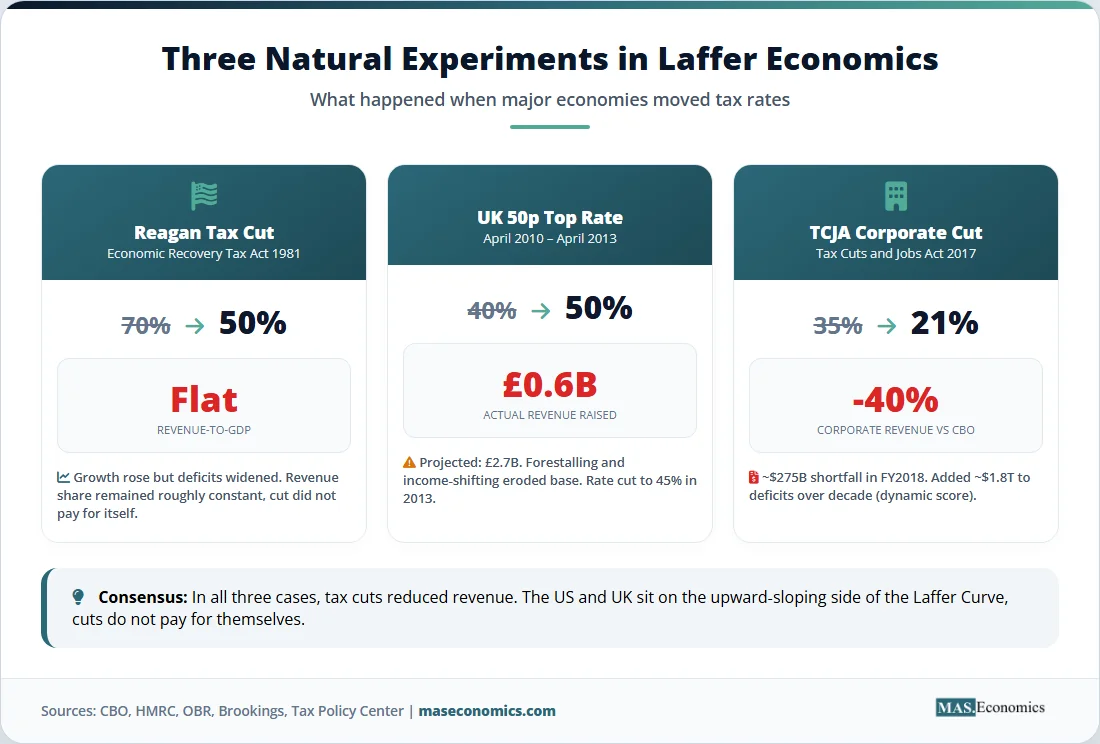
The UK provides a rare natural experiment. In April 2010, the Labour government raised the top marginal rate on incomes above £150,000 from 40% to 50%. HMRC’s 2012 analysis concluded that the increase raised considerably less than projected, with most of the expected revenue dissipated through forestalling, income-shifting, and reduced reported income. The Office for Budget Responsibility estimated that the 50p rate would raise only around £0.6 billion annually on a liabilities basis, rather than the £2.7 billion originally forecast. The rate was reduced to 45% from April 2013. Subsequent reanalysis by the Institute for Fiscal Studies found the estimates had wide confidence intervals and were statistically consistent with both modest positive and modest negative revenue effects, suggesting the UK was straddling near the summit of its own curve rather than sitting clearly on one side.
The American evidence is equally instructive. The Economic Recovery Tax Act of 1981 cut the top US federal rate from 70% to 50%, and supply-side advocates predicted the cut would pay for itself. Real GDP grew briskly between 1983 and 1989, but federal revenue as a share of GDP remained roughly flat, consistent with a tax cut that expanded the base enough to offset much of the rate reduction without generating surplus revenue. The 2017 Tax Cuts and Jobs Act, which reduced the US corporate rate from 35% to 21%, offers a cleaner test. The Brookings Institution found that actual federal revenue in fiscal year 2018 fell roughly $275 billion below the Congressional Budget Office’s pre-TCJA projection. Corporate revenue alone dropped about 40% relative to projections. The Congressional Budget Office ultimately estimated that the TCJA increased federal deficits by approximately $1.8 trillion over a decade on a conventional basis, and around $1.4 trillion after accounting for dynamic growth effects. The tax cut did not pay for itself. It reduced revenue substantially, as most neutral analysts predicted it would.
The chart below plots the theoretical Laffer Curve for labour income taxation, with the revenue-maximising peak at approximately 63% based on the midpoint of credible empirical estimates. The current effective top marginal positions of the United States and the United Kingdom are marked to illustrate that both countries sit on the upward-sloping side of the curve, where tax increases raise revenue and tax cuts reduce it.
Source: Author’s illustration based on Diamond and Saez (2011, Journal of Economic Perspectives), Trabandt and Uhlig (2011, Journal of Monetary Economics), Saez, Slemrod, and Giertz (2012, Journal of Economic Literature), and Splinter (2026). Revenue is indexed so that the peak equals 100. Current positions approximate combined top marginal labour tax rates inclusive of federal/national, state/local, and payroll components.
The pattern across studies is consistent. Revenue-maximising rates cluster in a range from roughly 50% to 70%, varying with the tax base, country, time period, and methodology. Sweden’s 1970s tax system, with top marginal rates well above 70%, is one of the few historical cases credibly placed on the right side of the curve. Everywhere else, the policy-relevant question is not whether tax cuts will raise revenue, because they almost certainly will not, but how much revenue will be lost and whether the growth effects justify the fiscal cost.
Why a Napkin Still Shapes Policy
Despite empirical evidence that most tax cuts reduce rather than raise revenue, the Laffer Curve remains central to fiscal policy debates across the developed world. Three reasons explain its persistence, and understanding them clarifies why the framework matters even when its bolder claims do not survive scrutiny.
The first reason is that the curve’s core logic is correct even when its political applications are not. Tax systems do have revenue-maximising rates. Behavioural responses to taxation are real, substantial, and economically consequential. The elasticity of taxable income is a genuine parameter that any serious tax design must accommodate. A government contemplating a top rate of 85% should indeed worry that the marginal dollar will not materialise. The mistake lies not in taking the curve seriously but in assuming every economy sits on its right-hand side. The United States, United Kingdom, Canada, and Australia all currently operate on the upward-sloping portion for most tax instruments, which means the Laffer mechanism constrains how high rates can be raised but does not justify cutting them to raise revenue.
The second reason is that the curve shifts the burden of proof in fiscal debates. Before Laffer, advocates of tax cuts had to argue that reduced revenue was a price worth paying for greater efficiency or reduced government. After Laffer, they could argue that no such trade-off existed: cuts would pay for themselves, so opposing them meant opposing both lower taxes and higher revenue simultaneously. This rhetorical move has proved remarkably durable. It reappears in every cycle of US tax-cut advocacy, from the 1981 Economic Recovery Tax Act to the 2001 and 2003 Bush cuts to the 2017 TCJA to ongoing proposals to cut the corporate rate further. Each round has been empirically disappointing, but the rhetorical template survives because it aligns the fiscal interests of government with the distributional interests of high earners. This is an instance of what public choice theory would predict: economic arguments that serve concentrated interests with disproportionate political influence tend to endure even when the evidence against them accumulates.
The third reason is that the curve connects to a genuinely difficult question in welfare economics. Even if we could identify the revenue-maximising rate, we would not necessarily want to set taxes there. Moving from a rate below the peak to the peak itself raises revenue, but it also raises deadweight loss, because the distortions per dollar of revenue collected rise as rates climb. The Kaldor-Hicks criterion provides one way to think about the trade-off: a policy is efficient if the winners gain enough to compensate the losers, whether or not they actually do. Applied to taxation, this suggests that the welfare-maximising rate is generally below the revenue-maximising rate, because at high rates the marginal welfare cost per additional dollar of revenue exceeds its social value. Diamond and Saez argued that for certain welfare criteria the two rates roughly coincide, but their analysis depends on assumptions about the marginal social value of redistribution that reasonable people dispute.
The policy implications for developed economies are clearer than the political debate suggests. For the United States, where the combined top marginal rate on labour income sits near 48% once federal, state, and payroll components are aggregated, modest increases in top rates would most likely raise revenue, though with rising distortion per dollar collected. The UK experience with the 50p rate, analysed through difference-in-differences methods by HMRC and the IFS, shows how hard it is to raise much revenue from the very top once forestalling and income-shifting are accounted for, but also how difficult it is to lose much revenue from modest changes. For Canada and Australia, broadly similar conclusions apply: current rates leave the countries on the rising portion of the curve, with room to raise revenue if political will permits and willingness to tolerate efficiency costs remains.
The Laffer Curve also has underappreciated relevance for countercyclical fiscal policy and debt sustainability. Governments facing high debt levels sometimes consider whether raising taxes can close fiscal gaps. If an economy is close to its Laffer peak, the scope for additional revenue through rate increases is limited, and alternative strategies become more attractive. These include broadening the tax base by closing loopholes, which lowers the effective elasticity and raises revenue without raising rates; shifting toward consumption taxes, whose Laffer curve is flatter because consumption is less elastic to taxation than labour or capital; and reforming fiscal and monetary policy coordination to address structural imbalances rather than relying solely on marginal rate adjustments. The curve thus reframes rather than resolves fiscal policy debates, reminding policymakers that every rate choice implies behavioural responses that must be priced into revenue forecasts.
Australia’s experience with the carbon tax, Canada’s with the goods and services tax, and the US states’ varying top income tax rates all provide ongoing natural experiments in where the relevant curves peak. The research finding that most developed economies sit on the rising portion of the curve is robust, but the flatness of the curve near its peak means that modest changes in rates produce modest changes in revenue, whether up or down. This has the ironic implication that the Laffer Curve, having been invoked to justify sweeping tax cuts, instead counsels against sweeping claims in either direction. Tax policy operates in the range where both rates and revenue matter, and neither can be inferred from the other without careful empirical work.
MASEconomics Explains
Four economic concepts behind the Laffer Curve
Conclusion
The Laffer Curve economics framework captures a genuine and important insight: taxation alters behaviour, the tax base responds to rates, and at sufficiently high rates further increases reduce rather than raise revenue. Five decades of empirical research have confirmed that the curve exists, that its peak lies somewhere between roughly 50% and 70% for most labour income tax systems, and that nearly all developed economies operate on the upward-sloping side. The policy implication is the opposite of what supply-side rhetoric has long claimed: in the United States, United Kingdom, Canada, and Australia, tax cuts generally lose revenue and tax increases generally raise it. The TCJA, the Reagan tax cuts, and the UK 50p experiment all reinforce this conclusion. The curve matters not because it tells us to cut taxes but because it quantifies the real limits on how much revenue any tax system can extract, the real distortions that accumulate as rates rise, and the real difficulty of designing a fiscal system that balances revenue, efficiency, and equity at the same time.
Did you find this article helpful? Share it with someone who loves economics. And remember, at MASEconomics, we make complex ideas simple.