The Consumer Price Index is built each month from roughly 80,000 price quotes collected across 75 metropolitan areas, then aggregated into more than 200 expenditure categories and finally into a single headline number that affects Social Security cheques, federal tax brackets, and trillions of dollars of inflation-linked debt. The most recent release, covering April 2026, showed headline CPI at 333.020 on the 1982-1984=100 base, equivalent to a 3.8 percent year-on-year increase, the highest reading since May 2023, per the Bureau of Labor Statistics. Core CPI rose 2.8 percent over the same window. The release moves the bond market more than almost any other scheduled statistic, and the April print prompted a sharp reassessment of the Federal Reserve’s rate-cut path.
The arithmetic looks deceptively simple. The interpretation does not. Substitution behaviour, quality change, basket coverage, and geographic representation each pull the headline number away from what households actually experience, and the gap between the published index and lived inflation is what most CPI debates turn on. The sections below cover how the index is constructed, what the eight major groups weigh in the basket today, how the series has moved across 25 years of cycles, and where the methodology breaks down.
The Most Widely Watched Inflation Gauge
The CPI measures the average change over time in the prices paid by urban consumers for a representative basket of goods and services. The basket covers food, shelter, apparel, transportation, medical care, recreation, education, communication, and other goods and services. The BLS reports the index on a base of 1982-1984 equal to 100, so the April 2026 reading of 320 means the same basket costs roughly 3.2 times what it cost in the base period. The headline CPI is the year-on-year percent change in that index, and the most-cited core CPI strips out food and energy from the calculation to filter out the most volatile components.
Three audiences use the CPI for three distinct purposes. Households use it as a cost-of-living gauge. Governments use it to index Social Security benefits, federal income tax brackets, and Treasury Inflation-Protected Securities (TIPS) coupons. Central banks use it as one input into their inflation target, although the PCE price index published by the BEA is the Federal Reserve’s preferred measure rather than the CPI itself. For a broader treatment of how price indices fit into the wider phenomenon of inflation, the cluster’s anchor article works through every category of price-level change.
Eight Major Groups That Build the Basket
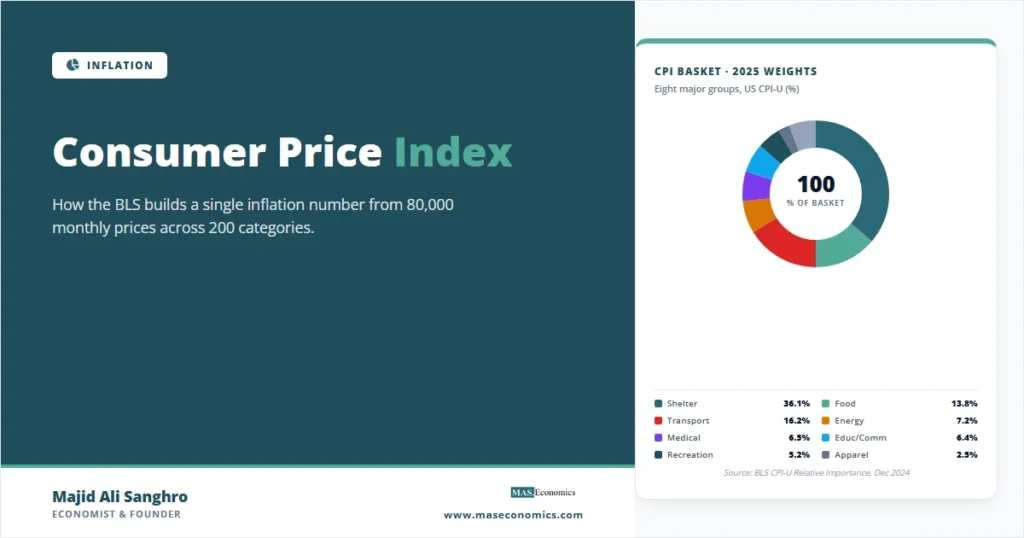
The CPI basket is divided into eight major groups, each containing several expenditure categories, each containing the entry-level items whose prices are actually collected. The weights attached to each group are revised every two years using data from the BLS Consumer Expenditure Survey, with monthly updates to the upper-level aggregation through the chained CPI (C-CPI-U) variant. As of the December 2024 weight update, the basket structure looks as follows in the BLS Relative Importance tables.
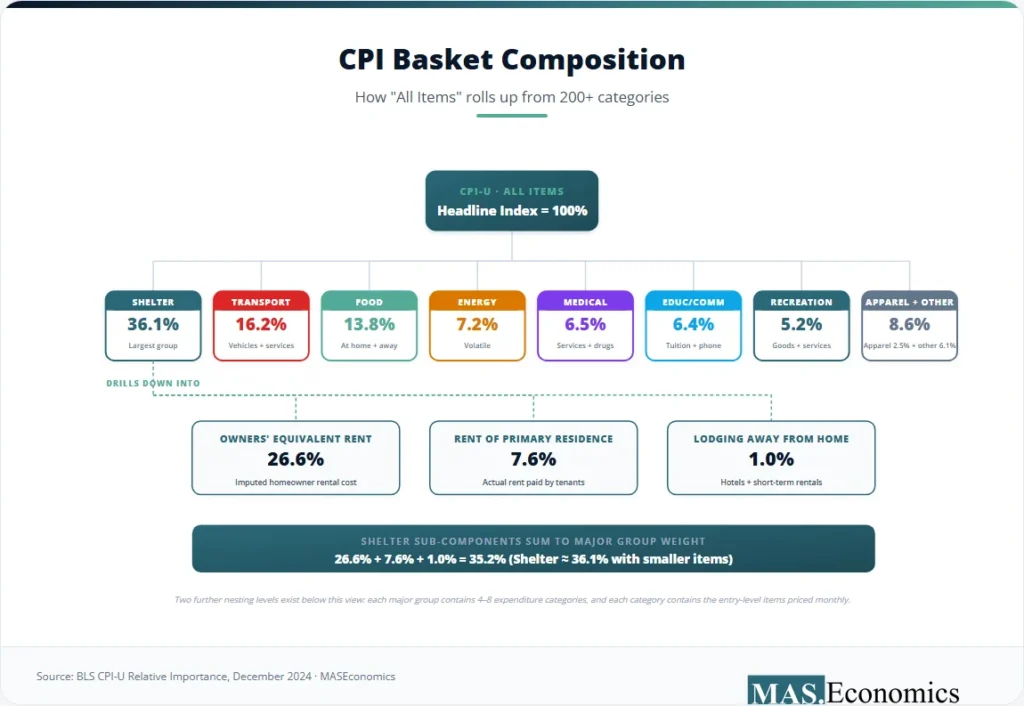
Shelter is the single largest component, and its dominance has implications that propagate through every CPI release. Within shelter, owners’ equivalent rent (OER) alone carries a weight of 26.6 percent. OER is an imputed rather than an observed price: the BLS asks homeowners what their dwelling would rent for in the current market, then uses that hypothetical rental as the price of housing services consumed. This imputation is one of the reasons that sticky services inflation dominates the last leg of any disinflation cycle: the OER index moves with a 12-18 month lag relative to market rents, so it keeps adding to CPI long after spot rents have stabilised.
The Laspeyres Formula and a Worked Example
The CPI follows a Laspeyres-type formula at the upper level of aggregation. The Laspeyres price index uses base-period quantities as fixed weights, so only price changes drive the index between weight updates.
Here \( P_{i,t} \) is the current-period price of item \( i \), \( P_{i,0} \) is the base-period price, and \( Q_{i,0} \) is the base-period quantity. The index compares the cost of buying the base-period basket at current prices to the cost of buying that same basket at base-period prices.
A two-good worked example makes the arithmetic concrete. Suppose the basket contains bread and milk. In the base year, bread costs USD 1.00 per loaf, and milk costs USD 2.00 per litre. Households purchase 100 loaves and 50 litres. In the current year, bread has risen to USD 1.20 and milk to USD 2.50. The Laspeyres index is:
The index reads 122.5, meaning prices have risen 22.5 percent since the base year. The Laspeyres construction is computationally cheap because the weights are fixed, and it can be calculated as soon as current prices are observed. The cost of that convenience is that any change in consumer behaviour between weight updates goes unrecorded, which generates the substitution bias that drives the gap between the CPI and the BEA’s chain-weighted PCE.
Major Group Weights and Their Contribution to Headline CPI
The table below shows the eight major groups, their current weights, illustrative year-on-year price changes from a typical late-cycle month, and the contribution each group made to that month’s headline reading. Contribution is the product of weight and year-on-year change, expressed in percentage points.
| Major Group | Weight (%) | YoY Change (%) | Contribution (pp) |
|---|---|---|---|
| Shelter | 36.1 | 5.1 | 1.84 |
| Transportation | 16.2 | 2.7 | 0.44 |
| Food | 13.8 | 2.4 | 0.33 |
| Energy | 7.2 | -0.8 | -0.06 |
| Medical care | 6.5 | 3.6 | 0.23 |
| Education and communication | 6.4 | 2.0 | 0.13 |
| Recreation | 5.2 | 1.9 | 0.10 |
| Apparel and other | 8.6 | 2.8 | 0.24 |
| Headline CPI | 100.0 | 2.9 | 3.25 |

|
|||
Two facts in the table do most of the analytical work. First, shelter contributes 1.84 percentage points to a 2.9 percent headline reading, which is nearly two-thirds of the total. When OER decelerates, headline CPI decelerates. When OER accelerates, headline CPI accelerates, regardless of what the other seven groups are doing. Second, energy’s high volatility is exactly why core CPI excludes it: the swings are large enough to dominate the headline in either direction, even though the underlying inflation pressure may be doing the opposite. The April 2026 release demonstrated the energy mechanism precisely. With gasoline up 28.4 percent year-on-year and the energy index up 17.9 percent, energy alone accounted for more than 40 percent of the monthly headline gain, while core CPI rose only 0.4 percent on the month and 2.8 percent year-on-year. The same release also flagged a re-acceleration in shelter, with rent and OER components ticking up 0.6 percent on the month after several quarters of cooling, a reminder that the largest CPI component is also the one most prone to lag the rest of the cycle.
CPI Across Two Decades of Cycles
The CPI series has run through every macro regime of the past 25 years: low and stable inflation through the 2000s, the brief 2008 spike and 2009 deflation, a long stretch of below-target readings through the 2010s, then the 2021-2024 surge and the disinflation back toward target. The chart below tracks headline CPI and core CPI on the same axis from 1999 through 2025.
Two patterns deserve attention. Headline volatility is roughly 60 percent higher than core volatility across the window, driven entirely by food and energy. The standard deviation of headline CPI across 1999-2025 is 1.9 percentage points; for core CPI, it is 1.2. And core inflation breached the Fed’s 2 percent target meaningfully only twice in 25 years: briefly in 2006-2008, and substantially during the 2021-2024 surge. The persistence of the 2021-2024 core overshoot, particularly in services ex-shelter, is what justified the Federal Reserve’s 525 basis points of cumulative tightening between March 2022 and July 2023.
Substitution Bias and the Path to Chain-Weighting
The Laspeyres construction holds basket quantities fixed at base-period levels. When relative prices change, consumers substitute toward cheaper goods, but the Laspeyres index continues to weight the more expensive items as if no substitution occurred. The result is an upward bias in measured inflation. The magnitude is small but persistent. The BLS Boskin-era methodology reviews estimated upper-level substitution bias at roughly 0.2 percentage points per year, which compounds to a meaningful gap over a decade.
The BLS responded in two stages. Hedonic regression was introduced for quality-changing goods in the 1980s and 1990s. The chained CPI (C-CPI-U) was introduced in 2002, using current-period quantity data to update the upper-level aggregation each month. The chained variant runs roughly 0.3 percentage points below the standard CPI-U in most years. The BEA’s PCE price index, computed natively as a Fisher chain index, captures substitution even more fully and runs 0.3-0.5 percentage points below the CPI on average. The persistent wedge between CPI and PCE is one reason the Fed targets the PCE rather than the CPI, a point developed at length in the causes of inflation survey.
Hedonic Adjustments and Quality Change
Hedonic regression separates pure price change from quality change. The BLS estimates a regression of the price of a product on its observable characteristics (screen size, processor speed, energy efficiency, vehicle horsepower) and uses the coefficients to value quality differences when a sampled item is replaced. If a new smartphone costs USD 100 more than its predecessor but ships with a 30 percent faster processor and a brighter screen, the hedonic adjustment attributes part of the price increase to the quality improvement rather than to pure inflation.
The technique now covers televisions, computers, smartphones, appliances, rental housing, and several apparel categories. Critics argue that hedonic adjustments systematically understate inflation because quality improvements are valued at market prices that may themselves be biased. Defenders point out that without hedonic adjustment, the CPI would treat the entire price jump from a flip phone to a smartphone as inflation, which would clearly overstate the cost-of-living impact. The BLS documentation on quality adjustment sets out the procedure in detail. The opposite problem also exists: shrinkflation reduces pack sizes while holding prices steady, and the CPI is supposed to capture the per-unit price increase through unit-based pricing, but coverage is incomplete in some categories.
Why the CPI Differs From Households’ Lived Experience
The published CPI is an average. Each household’s living inflation rate is its own basket weighted by its own spending pattern. Lower-income households devote a larger share of spending to food, energy, and rent, all categories where price increases have run above the CPI average in recent years. Higher-income households spend more on services and discretionary goods, several of which have seen flat or declining real prices over the past decade.
The BLS publishes experimental indices for elderly households (CPI-E) and for urban wage earners (CPI-W), the latter being the index used to compute Social Security cost-of-living adjustments. Independent estimates of how inflation hits households differently typically find a 50-100 basis point inflation gap between the lowest and highest income quintiles during periods of high food or energy inflation, and the gap also reflects differences in housing tenure: renters faced sharper shelter inflation than homeowners over 2022-2024. The ONS in the UK has explicitly responded to this distributional concern by publishing the Household Costs Indices, which weight each household equally rather than weighting by expenditure share.
How CPI Differs From PCE, RPI, and HICP
Four price indices dominate developed-economy inflation measurement, and the differences matter for interpretation.
The CPI uses a fixed-weight Laspeyres construction with biennial weight updates, covers urban consumer purchases, and is published by the BLS. The PCE price index uses a chain-weighted Fisher construction with monthly weight updates, covers broader household consumption (including spending made on behalf of households, such as employer-paid health insurance), and is the Fed’s preferred gauge. The UK Retail Prices Index uses an arithmetic mean at the elementary aggregation level, includes mortgage interest, and runs above CPI by roughly 0.5-1.0 percentage points, which is why it has been deprecated for most official uses. The euro-area Harmonised Index of Consumer Prices published by Eurostat is the ECB’s target measure and uses a methodology similar to the CPI but with cross-country harmonisation rules.
For US contexts, the CPI is what determines tax bracket indexation, Social Security adjustments, and TIPS coupons, while the PCE is what determines whether the Fed is hitting its target. Both indices typically point in the same direction, but the level differs persistently, and the gap is large enough to matter for any contract that indexes to one rather than the other.
MASEconomics Explains
Four economic concepts behind the Consumer Price Index
These concepts are explored in depth across our educational articles library.
Explore the MASEconomics BlogConclusion
The Consumer Price Index is the most widely used inflation gauge in the United States and the legal basis for indexing trillions of dollars of contracts, benefits, and tax brackets. The index is built from 80,000 monthly prices, weighted by household expenditure shares, and aggregated through a Laspeyres formula at the upper level, with chained variants available for substitution-corrected use. Shelter, and within it owners’ equivalent rent, dominates the headline reading and drives most of the persistence that makes the last leg of any disinflation cycle the hardest. Substitution bias, hedonic complications, and basket coverage gaps each pull the published index away from individual household experience, which is why central banks watch the PCE in parallel and statistical agencies have introduced chained and household-weighted variants over the past two decades. The CPI remains the reference series for cost-of-living adjustment in US law and for monthly inflation discussion globally.
Frequently Asked Questions
What is the Consumer Price Index in simple terms?
The Consumer Price Index tracks how much a representative basket of goods and services purchased by urban households costs today compared to a base period. The BLS reports the index on a 1982-1984 base of 100, and the year-on-year percent change is what most people call “the inflation rate.” It is used to adjust Social Security payments, federal tax brackets, and inflation-protected bonds.
How is the CPI calculated?
The BLS collects roughly 80,000 prices each month across 75 metropolitan areas, weights each item by its share of household spending from the Consumer Expenditure Survey, and applies a Laspeyres-type formula at the upper aggregation level. The basket weights are revised every two years, and a chained variant (C-CPI-U) updates the upper-level weights monthly to correct for substitution behaviour.
What is the difference between CPI and PCE?
The CPI uses fixed Laspeyres weights, covers urban consumer purchases, and is published by the BLS. The PCE price index uses chain-weighted Fisher aggregation, covers broader household consumption including spending made on behalf of households, and is published by the BEA. PCE runs 0.3-0.5 percentage points below CPI on average, and it is the Federal Reserve’s preferred inflation gauge.
Why is shelter such a large part of the CPI?
Shelter carries a 36.1 percent weight because housing is the largest single category in household budgets. Within shelter, owners’ equivalent rent alone weighs 26.6 percent, since most US households are homeowners and the BLS uses imputed rent as the price of housing services. OER moves with a 12-18 month lag relative to market rents, which is why shelter dominates the late phase of any inflation cycle.
What are the main limitations of the CPI?
Three limitations matter most. Substitution bias means the fixed-weight Laspeyres construction overstates inflation when consumers shift to cheaper goods. Quality change requires hedonic adjustment for technology and vehicles, which introduces estimation noise. Coverage averages over all urban consumers, so individual household experience can diverge from the published index, especially for lower-income or elderly households whose baskets differ from the average.
Thanks for reading! If you found this helpful, share it with friends and spread the knowledge. Happy learning with MASEconomics