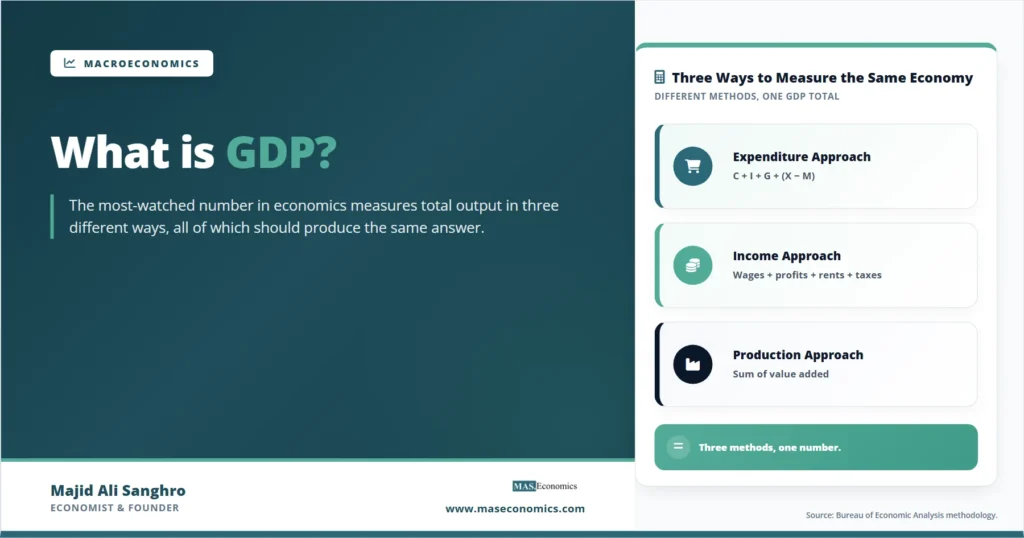
What is GDP? Gross Domestic Product is the most-watched number in economics, the headline figure that determines whether news anchors say the economy is growing or shrinking, whether central banks tighten or ease, and whether governments win or lose elections. It is also one of the most misunderstood. Most people who follow economic news could not explain what GDP actually counts, what it leaves out, or why the same economy can be measured three different ways and is supposed to give the same answer each time.
The official definition is technical but worth quoting once: GDP is the total market value of all final goods and services produced within a country’s borders during a specific period. Five words in that sentence do the heavy lifting. Market value means prices, not physical quantities. Final means consumer-ready, not intermediate inputs. Produced means new output, not resales. Within a country’s borders, GDP distinguishes itself from GNP. During a specific period means a flow, usually a quarter or a year. Get those five words right, and the rest of GDP follows.
Why GDP Exists
Before the 1930s, no government measured its economy in any unified way. The Great Depression changed that. President Franklin Roosevelt’s administration commissioned the economist Simon Kuznets to construct a comprehensive measure of US national income, which he delivered in a 1934 report to Congress. Kuznets’s work, expanded during the Second World War to support war planning, became the foundation of modern national income accounting. The framework was internationalized through the United Nations System of National Accounts, which gives most countries today a common methodology.
The motivation has not changed. A government managing the economy, a central bank setting interest rates, a business deciding where to invest, and a citizen evaluating policy all need a single, comparable number that summarizes economic activity. GDP is that number. Whether it is the right number is a separate question, and one this article returns to.
Three Approaches to Measuring GDP
GDP can be calculated in three ways, each starting from a different angle but, in principle, arriving at the same total. The three methods are tied together by an accounting identity: every dollar of output sold is a dollar of someone’s expenditure and a dollar of someone’s income. The three approaches simply count the same flow at different points in the circular flow of the economy.
The Expenditure Approach
The expenditure approach adds up everything spent on final goods and services in the economy. It is the most familiar form and produces the equation that appears in every macroeconomics textbook:
Expenditure Approach
Consumption is typically the largest component, accounting for around 60 to 70 percent of GDP in advanced economies. Investment includes business spending on equipment, structures, and inventories, plus residential construction. Government spending counts only purchases of goods and services, not transfers such as social security payments, because transfers are not direct purchases of output. Net exports, the difference between what a country sells abroad and what it buys from abroad, can be positive or negative.
The expenditure approach is the version that drives the news cycle. When a quarterly GDP release moves markets, it is almost always the expenditure-side breakdown that analysts dissect.
The Income Approach
The income approach adds up all incomes earned in producing the output. Wages and salaries paid to workers, profits earned by firms, rental income from property, interest income from capital, and taxes paid on production minus subsidies received together account for total income generated. The logic is simple: someone earned every dollar that someone else spent. In principle, total income equals total expenditure.
In practice, the two approaches do not match exactly because of measurement errors, sampling differences, and timing issues. The gap is called the statistical discrepancy and is small relative to the total, but it is not zero. The Bureau of Economic Analysis in the United States publishes both an expenditure-side estimate (GDP) and an income-side estimate (Gross Domestic Income, or GDI), and economists often look at the average of the two as a more reliable measure of underlying activity.
The Production Approach
The production approach, sometimes called the value-added approach, adds up the value added at each stage of production across all industries. Value added is the output of an industry minus the cost of intermediate inputs it purchased from other industries. Summed across the whole economy, value added equals GDP.
This approach avoids double-counting. If steel sells for $100 to a carmaker who turns it into a car selling for $30,000, only $30,000 enters GDP, not $30,100. The steel’s $100 is already embedded in the car’s price as an intermediate input. Counting it separately would inflate the total.

Nominal GDP and Real GDP
If GDP rises from one year to the next, it could be because the economy actually produced more, because prices went up, or some combination of the two. Without separating these, GDP would tell us little about whether living standards are improving. This is the distinction between nominal and real GDP.
Nominal GDP is measured in current prices, the prices that prevailed during the period being measured. It captures both quantity changes and price changes mixed together.
Real GDP is measured in constant prices, holding prices fixed at a reference year. Changes in real GDP reflect changes in actual output. This is the version economists care about when they discuss GDP growth, recessions, and standards of living.
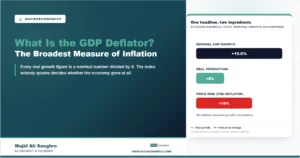
The bridge between the two is the GDP deflator, a price index calculated as the ratio of nominal to real GDP:
GDP Deflator
The deflator differs from the Consumer Price Index in important ways. The CPI tracks a fixed basket of consumer goods, while the GDP deflator covers everything produced domestically, including investment goods, government services, and exports. The two usually move together but can diverge during periods when, for example, oil prices change sharply, or import prices move differently from domestic prices.
| Year | Output (units) | Price per unit | Nominal GDP | Real GDP (Year 1 prices) | GDP deflator |
|---|---|---|---|---|---|
| Year 1 (base) | 100 | $10 | $1,000 | $1,000 | 100 |
| Year 2 | 105 | $11 | $1,155 | $1,050 | 110 |
| Year 3 | 108 | $12 | $1,296 | $1,080 | 120 |
| Year 3 vs Year 1 change | +8% | +20% | +29.6% | +8% | +20% |
|
Source: Illustrative numbers based on national accounts methodology.
|
|||||
The example illustrates why the distinction matters. Nominal GDP rose by nearly 30 percent across the three years, but most of that increase came from rising prices. Real output grew by only 8 percent. Confusing the two would dramatically overstate the improvement in living standards.
GDP Per Capita: Adjusting for Population
Total GDP measures the size of an economy. It does not measure the prosperity of an average resident. A country with 1.4 billion people and a $20 trillion economy is producing roughly the same per person as a country with 8 million people and a $114 billion economy, even though the totals look incomparable. To compare living standards, economists use GDP per capita: total GDP divided by the population.
GDP per capita is a much better proxy for average living standards than total GDP, but it has its own limits. It is an average, not a distribution. A country where most of the GDP gains go to a small share of the population can show rising GDP per capita while most households see no improvement. Inequality measures are needed alongside GDP per capita to give a fuller picture.
Purchasing Power Parity
Comparing GDP per capita across countries requires converting different currencies into a common unit. The simplest method uses market exchange rates, but this distorts comparisons because prices for non-traded goods, such as haircuts, rent, and restaurant meals, differ enormously across countries. A US dollar buys more in India than in Switzerland, even though the exchange rate values it the same.
Purchasing power parity, or PPP, adjusts for these price-level differences. The World Bank and the IMF publish PPP-adjusted GDP estimates that try to measure how much each country’s output would cost if prices were the same everywhere. PPP-adjusted figures usually narrow the apparent gap between rich and poor countries, sometimes substantially. By PPP, China overtook the United States as the world’s largest economy around 2016, even though it remains smaller by market exchange rates.
GDP versus GNP and GNI
Three closely related concepts are often confused: GDP, Gross National Product (GNP), and Gross National Income (GNI).
GDP measures output produced within a country’s borders, regardless of who owns the factories or workers. A Japanese-owned car plant operating in Tennessee adds to US GDP, not Japanese GDP.
GNP measures output produced by a country’s residents and firms, regardless of where in the world the production happens. That same Japanese plant in Tennessee adds to Japanese GNP, not US GNP. The conversion from GDP to GNP involves adding net income from abroad: dividends, profits, and labor income earned by residents from foreign sources, minus equivalent income earned by foreigners domestically.
GNI is the income-side equivalent of GNP and is the term used in the modern System of National Accounts. In practice, GNI and GNP refer to the same concept, with GNI being the more current name.
For most large economies, GDP and GNI differ by only a few percentage points. For some smaller economies, especially financial centers or countries with large diasporas, the gap can be much larger. Ireland is the textbook example: its GDP includes substantial output produced by foreign-owned multinationals using transfer-pricing strategies, making Irish GDP per capita appear far higher than what is actually available to Irish residents. The Irish Central Statistics Office now publishes a Modified Gross National Income (GNI*) series that strips out these distortions and gives a more realistic picture of domestic economic activity.
How GDP Data Is Produced and Revised
GDP is not measured. It is estimated, from many different data sources, with significant uncertainty, and revised repeatedly for years after the initial release. In the United States, the Bureau of Economic Analysis publishes three estimates of quarterly GDP: an advance estimate about a month after the quarter ends, a second estimate a month later, and a third estimate another month after that. Annual revisions and benchmark revisions continue for years.
The data inputs come from business surveys, household surveys, tax records, financial reports, trade statistics, and administrative records. Some components, such as government spending on payroll, are measured directly and accurately. Others, such as the value added by financial services or imputed rents on owner-occupied housing, involve substantial estimation. The advance GDP release is often revised by half a percentage point or more, occasionally more than a full percentage point. The 2008 financial crisis was initially reported as a much milder downturn than it eventually proved to be once revisions came in.
Note. Real-time GDP analysis should always be treated as provisional. The numbers economists discuss today will look different in a year and very different in five years. This is why business cycle dating bodies such as the National Bureau of Economic Research do not rely on GDP alone.
What GDP Does Not Capture
GDP was designed to measure market production, and it does that reasonably well. It was never designed to measure welfare, happiness, sustainability, or the distribution of prosperity. Several important activities and concerns lie outside its scope.
Non-market activity. Household production, volunteer work, and informal care are not counted, even though they generate real economic value. A parent caring for children at home contributes nothing to GDP. The same parent paying a daycare provider would.
The informal economy. In many developing countries, a large share of economic activity happens outside the tax and regulatory system. Statistical offices try to estimate it, but the figures are inevitably approximate. The informal sector can account for 30 to 50 percent of activity in some economies.
Environmental degradation and resource depletion. Cutting down a forest increases GDP through timber sales, with no offsetting deduction for the loss of the forest as a natural asset. Oil extraction adds to GDP without subtracting the depletion of the reserve. Various efforts at “green GDP” or natural capital accounting have tried to address this, but no widely adopted standard yet exists.
Distribution. GDP per capita is an average. It can rise while median household income stagnates if the gains are concentrated. This is why studies of income inequality are essential companions to GDP figures.
Quality changes and new goods. A smartphone today is vastly more capable than a phone from twenty years ago at a similar real price. National accounts use hedonic adjustments to try to capture quality improvements, but the methodology is imperfect, and many economists believe real GDP growth in the digital era is understated as a result.
Well-being and life satisfaction. GDP is a measure of production, not of how people feel about their lives. Several countries, beginning with Bhutan’s Gross National Happiness index in the 1970s and continuing with OECD work on well-being indicators, have experimented with broader measures. None has displaced GDP, but the recognition that GDP is incomplete has shaped the way it is used.
Kuznets himself, who pioneered the methodology, warned in his original 1934 report that “the welfare of a nation can scarcely be inferred from a measurement of national income.” The warning has been repeated many times since. GDP remains the dominant single statistic because no alternative has matched its simplicity, comparability, and frequency of measurement, not because anyone believes it captures everything that matters.
Why GDP Still Dominates
Despite its limits, GDP is the closest thing economics has to a universal language. It is published quarterly by nearly every country, calculated using a common international framework, and available in a long enough historical series to track business cycles, growth trajectories, and crises. Central banks set policy partly in response to it. The IMF and World Bank organize their country comparisons around it. Politicians are judged by it. Markets move on it.
The most useful way to think about GDP is as a powerful but specific instrument. It measures market output. It does so with reasonable accuracy in most economies, with delays and revisions, and with known blind spots. Used carefully, alongside measures of inequality, employment, well-being, and sustainability, it tells most of the story of economic activity. Used alone, it tells part of the story and can mislead about the rest.
Explains
Four concepts that extend this introduction to GDP
Continue exploring macroeconomic measurement and analysis on the MASEconomics blog.
Explore the MASEconomics BlogConclusion
What is GDP? It is best answered by what it actually measures: the total market value of final goods and services produced within a country’s borders during a specific period, calculated three different ways that should give the same answer. The expenditure, income, and production approaches each count the same flow at different points in the circular flow of the economy. The distinction between nominal and real GDP separates output growth from price changes. Per capita figures translate aggregate output into approximate living standards, and PPP adjustments make those comparable across countries.
The framework was built in the 1930s to solve a specific problem, giving governments a single comparable measure of economic activity, and it has done that job well enough to remain the default for nearly a century. Its limits, the activities it misses, the welfare it does not measure, the distributional realities it averages over, are real and worth understanding. They do not make GDP wrong. They make it incomplete. Reading GDP carefully, with its companion measures of inflation, employment, inequality, and sustainability, is what economic literacy looks like in practice.
Frequently Asked Questions
What is GDP in simple terms?
GDP is the total market value of all final goods and services produced within a country’s borders during a specific period, usually a quarter or a year. It is the most-watched single number in economics and is used to compare the size and growth of economies.
What is the difference between nominal and real GDP?
Nominal GDP is measured in current prices and reflects both quantity and price changes. Real GDP holds prices constant at a base year, so it reflects only changes in actual output. Real GDP is the version used to discuss growth, recessions, and living standards. The ratio of the two, multiplied by 100, gives the GDP deflator, a measure of overall price changes in the economy.
What is the difference between GDP and GNP?
GDP measures output produced within a country’s borders regardless of who owns the production. GNP, now usually called GNI, measures output produced by a country’s residents and firms regardless of where in the world the production happens. For most large economies the two are close, but for countries with large foreign-owned production or significant remittance flows, the gap can be substantial.
Why is GDP per capita more meaningful than total GDP?
Total GDP measures the size of an economy, but a larger economy with a larger population is not necessarily a richer one. GDP per capita divides total GDP by population, producing a closer proxy for average living standards. It is still an average, so it does not capture how the gains are distributed, but it allows meaningful comparisons across countries of different sizes.
What does GDP not measure?
GDP does not capture non-market activity such as household production and volunteer work, much of the informal economy, environmental degradation and resource depletion, the distribution of income across households, quality improvements in goods, or subjective well-being. It measures market production, which is part of what shapes living standards but not the whole picture.
How accurate is GDP data when it is first released?
The first quarterly GDP release is an advance estimate based on incomplete data and is revised repeatedly. Revisions of half a percentage point are common, and larger revisions are not unusual, particularly during turning points such as the start of a recession. Annual and benchmark revisions can continue for years. Real-time GDP figures should always be treated as provisional.
Thanks for reading! If you found this helpful, share it with friends and spread the knowledge. Happy learning with MASEconomics