The 2026 Social Security COLA adds an average of $56 per month to retirement benefits for 71 million Americans, raising the typical monthly check from $2,015 to $2,071. For the 7.5 million recipients of Supplemental Security Income (SSI), the federal maximum payment increases from $967 to $994. Across all programmes, approximately 75 million people are affected by the adjustment, according to the Social Security Administration.
The 2.8% Social Security COLA for 2026 is slightly higher than the 2.5% adjustment in 2025 but well below the record 8.7% increase in 2023, which was driven by the post-pandemic inflation surge. Over the past decade, the average COLA has been approximately 3.1%. Three years in the past fifteen (2010, 2011, and 2016) saw no adjustment at all, because the CPI-W showed no increase in those periods.
The headline figure, however, tells only part of the story. Medicare Part B premiums are projected to rise to $202.90 per month in 2026, an increase of $17.90 from 2025. Since approximately 70% of beneficiaries have their Part B premiums deducted directly from their Social Security checks, the net increase for most retirees will be closer to $38 per month rather than $56. Meanwhile, healthcare costs for seniors continue to outpace the inflation index used to calculate the COLA, raising a fundamental question about whether the adjustment mechanism is fit for purpose.
Latest Developments
Table 1: Social Security COLA 2026 Timeline
| Date | Event |
|---|---|
| Jul – Sep 2025 | Bureau of Labor Statistics collects Q3 CPI-W data used to calculate the 2026 COLA |
| Oct 15, 2025 | Scheduled COLA announcement delayed due to federal government shutdown |
| Oct 24, 2025 | SSA announces 2.8% COLA for 2026, affecting 75 million beneficiaries |
| Nov 19, 2025 | Deadline to opt into online COLA notices via my Social Security account |
| Dec 31, 2025 | SSI recipients receive first increased payments (7.5 million people) |
| Jan 2026 | Social Security retirement, disability, and survivor beneficiaries receive COLA-adjusted payments |
| Jan 2026 | Taxable maximum earnings increase to $184,500 (from $176,100 in 2025) |
| Jan 2026 | Medicare Part B premium rises to $202.90/month, offsetting $17.90 of the $56 average increase |

|
|
Source: Social Security Administration, 2026 COLA Fact Sheet.
How the Social Security COLA Is Calculated
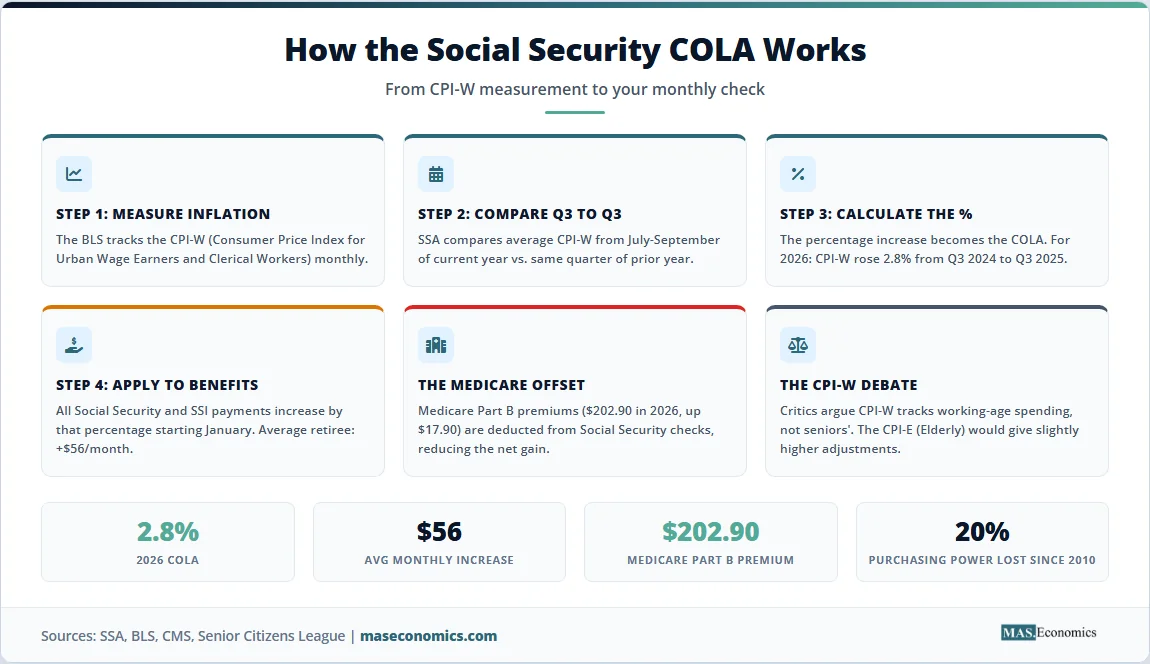
The Social Security COLA is tied by law to the Consumer Price Index for Urban Wage Earners and Clerical Workers (CPI-W), a measure of average price changes for goods and services typically purchased by hourly wage earners and clerical workers. The CPI-W is produced by the Bureau of Labor Statistics (BLS) within the Department of Labor.
The calculation compares the average CPI-W from the third quarter (July, August, September) of the current year with the average CPI-W from the third quarter of the prior year. If consumer prices rose, beneficiaries would receive a corresponding percentage increase in their payments. If prices did not rise, there would be no adjustment. Congress enacted automatic COLAs as part of the 1972 Social Security Amendments, and the first automatic adjustment took effect in 1975. Before that, benefits increased only when Congress passed specific legislation.
The 2026 COLA of 2.8% reflects the percentage increase in the CPI-W from Q3 2024 to Q3 2025. This is a mechanical calculation with no discretion: the SSA does not choose the COLA; it applies the formula that Congress established.
The choice of CPI-W as the index, however, is the subject of long-running debate. The CPI-W tracks spending patterns of urban wage earners, a population that includes younger workers whose budgets allocate more toward transportation, apparel, and education. Retirees, by contrast, spend disproportionately on healthcare and housing, categories where prices tend to rise faster than the overall CPI basket.
An alternative index, the CPI-E (Consumer Price Index for the Elderly), gives greater weight to healthcare and housing costs. According to analysis by the Center for Retirement Research at Boston College, the CPI-E has outperformed the CPI-W in 69% of years since 2000, averaging approximately 0.1 percentage points higher annually. Over 25 years, that small difference compounds to roughly $5,000 in lost purchasing power per retiree. The Senior Citizens League has estimated that Social Security benefits have lost approximately 20% of their buying power since 2010 as a result of this mismatch.
A third option, the chained CPI, adjusts for the tendency of consumers to substitute cheaper goods when prices rise. This measure would produce lower COLAs than the current formula. The Bipartisan Policy Center has estimated that switching to the chained CPI would reduce Social Security’s long-term funding shortfall by 14%, while switching to the CPI-E would increase it by 11%.
50 Years of Social Security COLA
The chart below shows every Social Security COLA since automatic adjustments began in 1975, providing the historical context needed to evaluate the 2026 adjustment.
Source: Social Security Administration. Annual COLA percentages, 1975 – 2026. COLAs from 1975 – 1982 took effect in July; from 1984 onward, they take effect in January.
Several patterns are visible in the historical data. The highest COLAs occurred during periods of severe inflation: 14.3% in 1980, 11.2% in 1981, and 8.7% in 2023. The three years with zero adjustment (2010, 2011, 2016) all followed periods of falling energy prices that held the CPI-W flat. The 2026 COLA of 2.8% is almost exactly at the 50-year median, reflecting an economy where inflation has moderated from the post-pandemic surge but remains above the Federal Reserve’s 2% target.
The United States is not alone in adjusting retirement benefits for inflation, but its approach differs from peer nations. The United Kingdom’s “triple lock” guarantees that the state pension rises by whichever is highest: inflation (CPI), average wage growth, or 2.5%. Canada’s Old Age Security is indexed quarterly to the CPI, providing more frequent adjustments. Germany indexes pensions to wage growth rather than consumer prices. Each approach reflects different policy priorities: the US system focuses on maintaining purchasing power relative to consumer prices; the UK system guarantees a minimum real increase; Canada’s system responds more quickly to price changes; and Germany’s system ties retirees’ living standards to the broader economy’s performance.
Table 2: 2026 Social Security COLA – Key Numbers at a Glance
| Measure | 2025 | 2026 | Change |
|---|---|---|---|
| COLA percentage | 2.5% | 2.8% | +0.3 pp |
| Average retired worker monthly benefit | $2,015 | $2,071 | +$56 |
| Average married couple monthly benefit | $3,120 | $3,208 | +$88 |
| Maximum monthly benefit (age 66+) | $5,108 | $5,251 | +$143 |
| Maximum SSI (individual) | $967 | $994 | +$27 |
| Maximum SSI (couple) | $1,450 | $1,491 | +$41 |
| Average SSDI monthly benefit | $1,586 | $1,630 | +$44 |
| Taxable maximum earnings | $176,100 | $184,500 | +$8,400 |
| Earnings limit (under full retirement age) | $23,400 | $24,480 | +$1,080 |
| Medicare Part B monthly premium | $185.00 | $202.90 | +$17.90 |
|
|
|||
Sources: SSA 2026 COLA Fact Sheet, Kiplinger, Centers for Medicare & Medicaid Services.
The Medicare Offset and Real-World Impact
The gap between the gross COLA increase and the net amount retirees actually receive is one of the most misunderstood aspects of Social Security economics.
Medicare Part B premiums are deducted directly from Social Security checks for approximately 70% of beneficiaries. In 2026, the standard Part B premium increases from $185.00 to $202.90, absorbing $17.90 of the average $56 monthly COLA increase. The Medicare Part A inpatient hospital deductible rises from $1,676 to $1,736, and the Part B outpatient deductible increases from $257 to $283. As Jim Komoroski, a registered Social Security analyst, told US News: the net gain for most retirees lands closer to $38 per month.
Beyond Medicare, the costs that disproportionately affect seniors continue to rise faster than the CPI-W captures. The Bureau of Labor Statistics reported that elderly home care costs increased 11.6% on an annual basis in September 2025, while medical services overall rose 3.9%. Housing costs, which account for approximately one-third of a typical retiree’s budget, have risen faster than the CPI-W basket in most metropolitan areas since 2020.
The National Council on Aging described the situation directly: “COLA might reflect the inflation rate, but it is woefully insufficient for older Americans who already have high health care costs and are facing even greater increases in their Medicare costs in 2026.” The Senior Citizens League’s annual survey found that only 10% of seniors are satisfied with their annual COLA, based on responses from 1,920 adults aged 62 and older.
A UMass Boston Gerontology Institute analysis estimated that 45% of older-adult households, more than 19 million, lack sufficient income to cover basic living costs based on cost-of-living data from its Elder Index. Poverty rates among Americans aged 65 and over were the only demographic group to see an increase between 2018 and 2023, according to NBC News, citing Census Bureau data.
How Working Retirees Are Affected
The Social Security COLA also adjusts the earnings limit that determines how much beneficiaries who are still working can earn before their benefits are reduced. In 2026, beneficiaries under full retirement age can earn up to $24,480 per year (up from $23,400 in 2025) before the SSA withholds $1 for every $2 earned above the limit. For workers reaching full retirement age during 2026, the limit is $65,160, with $1 withheld for every $3 earned above that threshold.
These limits matter because a growing number of Americans are working past traditional retirement age. According to BLS data, the labour force participation rate for Americans aged 65 and older has increased steadily over the past two decades, driven by a combination of inadequate retirement savings, rising costs, and longer life expectancies. For these workers, the interaction between Social Security benefits, earnings limits, and tax obligations creates a complex set of incentives that can discourage additional work or result in unexpected benefit reductions.
The taxable maximum, the ceiling on earnings subject to the Social Security payroll tax, rises to $184,500 in 2026. This means workers earning above this level pay no additional Social Security tax on the excess. The payroll tax rate remains unchanged at 6.2% for employees and 6.2% for employers, for a combined 12.4%. Self-employed individuals pay the full 12.4%. An additional 0.9% Medicare surtax applies to earnings above $200,000 for individuals ($250,000 for joint filers).
The long-term fiscal health of the Social Security programme depends heavily on the relationship between the taxable maximum, the number of workers paying into the system, and the benefits being paid out. The programme’s trust funds are projected to be depleted in the early 2030s, at which point incoming payroll taxes would fund only approximately 80% of scheduled benefits. Proposals to address this shortfall range from raising the taxable maximum to eliminating it entirely, from adjusting the COLA formula to raising the full retirement age. Each proposal involves tradeoffs between economic efficiency and equity that are at the core of fiscal policy debates.
Scenarios for the 2027 Social Security COLA
The 2027 COLA will be determined by CPI-W data from Q3 2026, which will be heavily influenced by the oil price shock caused by the Iran war and the Strait of Hormuz closure. Energy prices surged above $100 per barrel in early 2026, and gasoline hit a national record of $3.96 per gallon. If these elevated prices persist through the summer, the 2027 COLA could be significantly higher than the 2026 adjustment.
Table 3: Scenarios for the 2027 Social Security COLA
| Scenario | CPI-W Trajectory | Estimated 2027 COLA |
|---|---|---|
| Oil shock fades (Bull) | Islamabad Talks succeed; Hormuz reopens; oil returns below $80; CPI-W moderates | 2.0 – 2.5% |
| Elevated energy prices persist (Base) | Ceasefire holds but Hormuz partially restricted; oil stays near $95 – $100; tariffs add to consumer prices | 3.5 – 4.5% |
| Energy crisis deepens (Bear) | Ceasefire collapses; oil spikes above $130; gasoline exceeds $5; broad inflation re-accelerates | 5.0 – 7.0% |
|
|
||
Sources: MASEconomics scenario analysis based on BLS CPI data, EIA energy price forecasts, and current geopolitical developments.
MASEconomics Explains
Four economic concepts behind the Social Security COLA
Consumer Price Index (CPI)
The CPI measures the average change in prices paid by consumers for a basket of goods and services. The Social Security COLA uses the CPI-W variant, which tracks spending patterns of urban wage earners. Different CPI measures (CPI-U, CPI-W, CPI-E, chained CPI) produce different inflation readings because they weight spending categories differently and account for consumer substitution behaviour in different ways.
Purchasing Power
Purchasing power measures how much a given amount of money can buy. When prices rise faster than income, purchasing power declines. The COLA is designed to preserve the purchasing power of Social Security benefits, but if the index used to calculate it understates the inflation that beneficiaries actually experience, real purchasing power erodes over time. The Senior Citizens League estimates a 20% loss since 2010.
Indexation
Indexation is the practice of automatically adjusting payments, taxes, or other economic variables based on changes in a price index. Social Security benefits are indexed to the CPI-W. Tax brackets, the taxable maximum ($184,500 in 2026), and the earnings limit are indexed to average wages. The choice of which index to use has significant consequences for the size of adjustments and the long-term fiscal trajectory of the programme.
Fiscal Sustainability
Social Security’s trust funds are projected to be depleted in the early 2030s without legislative action. The COLA formula directly affects the programme’s fiscal sustainability: higher COLAs increase outlays, while lower COLAs reduce them. Switching from CPI-W to CPI-E would increase the funding shortfall by an estimated 11%. Switching to the chained CPI would reduce it by 14%. Every COLA debate is simultaneously a debate about the programme’s long-term solvency.
Explore our full library of economic explainers, from how the CPI is measured to how inflation erodes purchasing power.
Explore the MASEconomics Blog →Conclusion
The 2026 Social Security COLA of 2.8% is a moderate adjustment that reflects the return of inflation to more normal levels after the post-pandemic surge. The $56 average monthly increase provides a real but limited buffer against rising costs. After Medicare Part B premium deductions, most retirees will see a net increase closer to $38 per month. Healthcare costs, housing expenses, and everyday essentials continue to rise faster than the CPI-W captures, contributing to a long-term erosion of purchasing power that the current COLA mechanism is not designed to address.
The 2027 Social Security COLA, determined by CPI-W data collected during the summer of 2026, will reflect the economic impact of the Iran war, the Hormuz oil shock, and the tariff-driven price increases that are currently working through the economy. If energy prices remain elevated, the next adjustment could be substantially larger.
Did you find this article helpful? Share it with someone who loves economics. And remember, at MASEconomics, we make complex ideas simple.