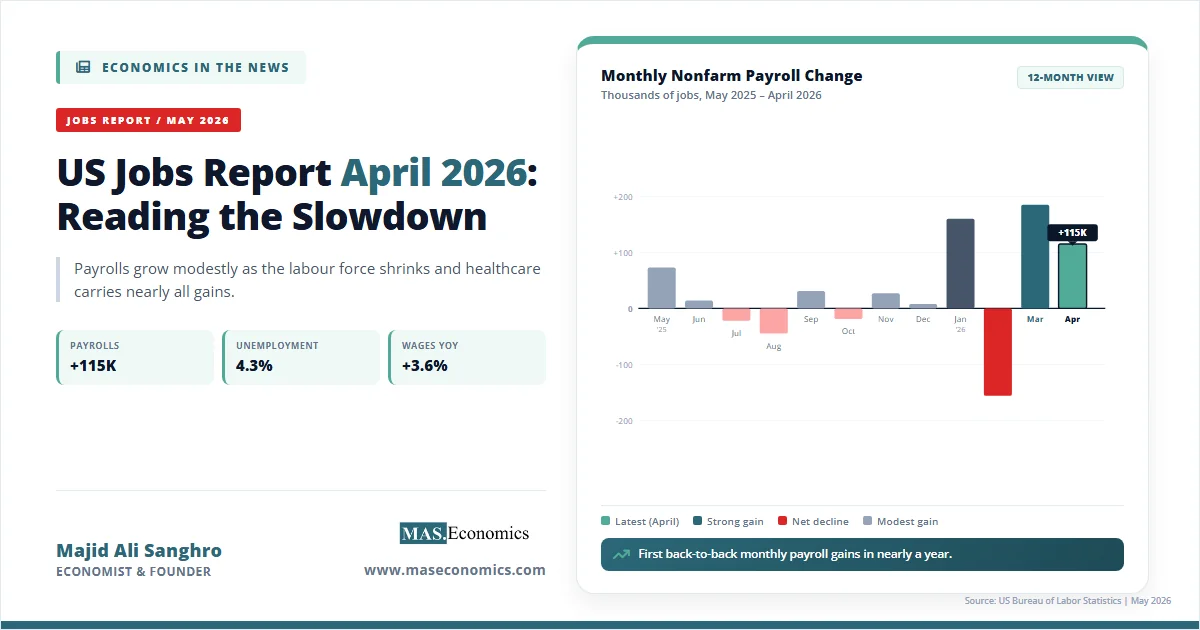
The April 2026 employment report landed on May 8, and the headline number told only part of the story. The US jobs report April 2026 showed nonfarm payrolls rose by 115,000, the unemployment rate held at 4.3 percent, and average hourly earnings climbed 0.2 percent over the month. The figure topped a Dow Jones consensus estimate of 55,000 and was the second consecutive month of gains, the first such streak in nearly a year.
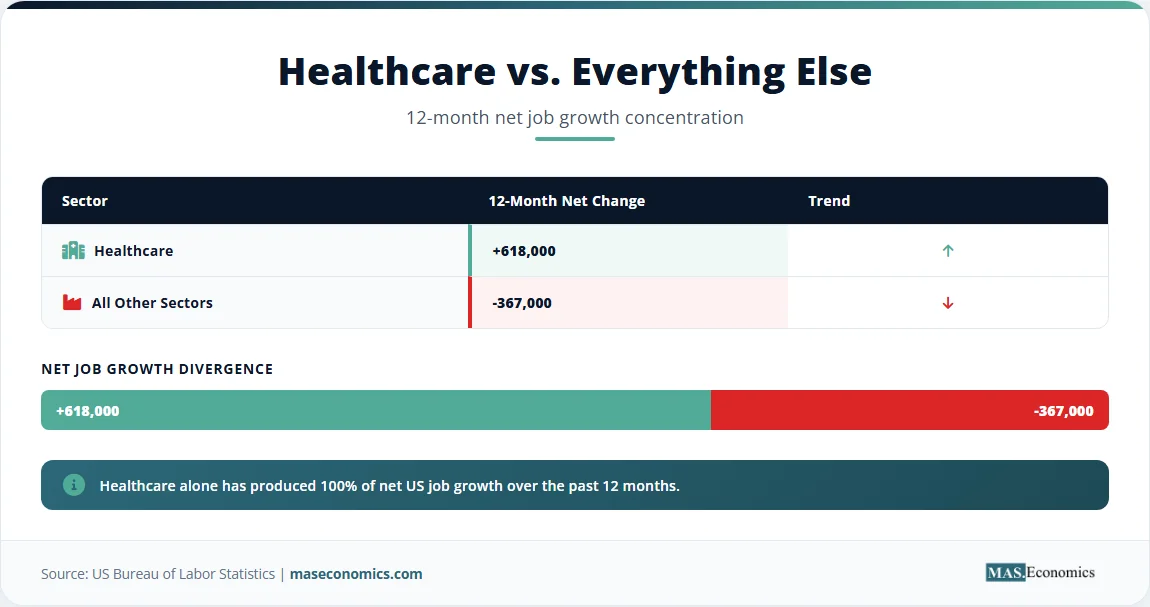
Underneath the surface, the picture is more complicated. February’s loss was revised deeper to -156,000, March was revised up to +185,000, and the labour force participation rate slid to 61.8 percent, the lowest reading since October 2021. Healthcare alone has added 618,000 jobs over the past year, while every other sector combined has shed 367,000. The labour market has not collapsed. It has split.
What April’s Numbers Show
The Bureau of Labor Statistics reported a 115,000 net gain in nonfarm payrolls for April, with the unemployment rate steady at 4.3 percent and the broader U-6 measure rising 0.2 percentage points to 8.2 percent. The labour force shrank by 226,000 in the household survey, which is the main reason the unemployment rate did not move despite a notable rise in those working part-time for economic reasons. That category jumped by 445,000 to 4.9 million, a level last seen in late 2021.
Average hourly earnings rose to $37.41, up 0.2 percent on the month and 3.6 percent over the year. Wage growth came in below expectations of 0.3 percent monthly and 3.8 percent annually. Real wage growth, after subtracting headline inflation, is roughly flat. The average workweek edged up to 34.3 hours, manufacturing overtime held at 3.0 hours, and the participation rate ticked down from 61.9 percent in March.
Sector composition matters more than the headline. Healthcare added 37,000 jobs in April, in line with its 32,000 average over the prior 12 months. Transportation and warehousing added 30,000, retail trade added 22,000, and construction was little changed. Federal government employment continued its multi-month decline with another 9,000 cut, manufacturing lost 2,000 jobs, and information lost 13,000. The “low-hire, low-fire” pattern that has defined the labour market since early 2025 remains intact: layoffs are near multi-decade lows, but hiring activity has shifted sideways.

How the Labour Market Got Here
The April report is the latest entry in a year-long deceleration. Through the first half of 2025, the BLS reported a monthly average payroll growth of about 110,000. By the second half of 2025, the average had fallen to roughly negative 7,700 jobs per month after benchmark revisions, a stunning shift that the preliminary CES benchmark revision for March 2025 captured at -911,000 total nonfarm jobs, or -0.6 percent.
The deterioration has multiple drivers. First, the labour force itself is barely growing. The participation rate has fallen from 62.6 percent in April 2025 to 61.8 percent in April 2026, an unusually large 12-month decline outside of a recession. Tighter immigration enforcement has slowed labour force entry, and demographic ageing continues to pull older workers out of the prime-age pool. Second, federal hiring has gone into reverse. The federal workforce has lost jobs in every recent print, a direct effect of administration restructuring. Third, manufacturing and information employment have struggled with the combined drag of tariffs, AI-related restructuring in tech, and weaker capital expenditure outside of the AI build-out.
The resilience of the headline unemployment rate at 4.3 percent reflects a paradox economists call the “frozen” labour market. Slow job creation does not push unemployment higher because the denominator, the labour force, is barely growing. As Indeed Hiring Lab observed, healthcare has carried almost the entire net job growth of the past 12 months, while every other major sector has been flat or down. That concentration is historically unusual and creates a fragility that headline numbers obscure.
This pattern fits within the broader story of central bank divergence in 2026, where the Fed has been forced to hold rates while the ECB and Bank of England have continued to ease. The labour market signal is not strong enough to justify cuts, but it is not robust enough to justify hikes either. April’s data does little to break that stalemate.
The Economics Behind the Slowdown
Three economic frameworks help interpret what the April report actually means for policy and forecasting.
The first is Okun’s Law, the empirical relationship between GDP growth and changes in the unemployment rate. The traditional Okun coefficient suggests that when growth runs roughly two percentage points below trend, unemployment should rise by one percentage point over a year. Real GDP growth has been positive but soft, and yet the unemployment rate has barely moved from 4.2 percent a year ago. The standard Okun relationship is breaking down because labour supply is contracting alongside labour demand. The participation rate decline of 0.8 percentage points over the past year mathematically offsets what would otherwise be a sharper rise in unemployment.
The second is the Phillips Curve. With unemployment at 4.3 percent, modestly above most estimates of the natural rate, traditional theory would predict gentle disinflation. Wage growth at 3.6 percent year-over-year is consistent with this: it is well below the 5.9 percent peak of March 2022 but still above the 3 to 3.5 percent range typically associated with stable 2 percent price inflation. The current wage trajectory tells the Fed that the labour market is loosening, but not enough to push core services inflation, especially shelter and medical care, decisively toward target. This is exactly the dynamic explored in our analysis of sticky services inflation.
The third framework is the Beveridge curve, the relationship between job openings and unemployment. The curve shifted unfavourably during the post-pandemic period, with high vacancies coexisting with elevated unemployment. By April 2026, vacancies have come down sharply from their 2022 peak, while the unemployment rate has crept up only modestly. The curve is moving back toward its pre-pandemic position, suggesting that matching efficiency in the labour market is improving even as the overall pace of activity slows. This is consistent with a soft landing scenario rather than a recession.
The composition of job gains matters for monetary policy because different sectors carry different inflation signals. Healthcare hiring is heavily driven by demographics and government reimbursement schedules, not the business cycle. The fact that nearly all net job growth is concentrated in healthcare means that the cyclical demand signal from payrolls is weaker than the headline 115,000 suggests. The Fed’s data-dependent posture, articulated in the April 29 FOMC statement that held the federal funds rate at 3.50 to 3.75 percent, becomes harder to maintain when the data is this ambiguous.
April Jobs Data in Detail
The single chart below tracks monthly nonfarm payroll changes from May 2025 through April 2026, showing the volatile pattern that has dominated the past year.
Source: US Bureau of Labor Statistics, Employment Situation reports, May 2025 to April 2026. Figures reflect seasonally adjusted nonfarm payroll changes after revisions.
The bar chart makes the bifurcation visible. From May 2025 through December 2025, monthly job changes oscillated narrowly around zero, with three negative months and four months below 30,000. The pattern then shifted sharply in 2026: a strong January (+160,000), a sharp drop in February (-156,000) tied to a healthcare strike, a rebound in March (+185,000), and the moderate April print of +115,000. The two-month average of +150,000 and the four-month average of roughly +76,000 both look healthier than the second-half-2025 trend, but they remain well below the 200,000-plus pace that defined the 2022-2024 expansion.
The table below summarises the key components of the April report alongside their March values and 12-month averages, which gives a clearer view of what is shifting and what is steady.
| Indicator | April 2026 | March 2026 (revised) | 12-Month Average |
|---|---|---|---|
| Nonfarm payroll change | +115,000 | +185,000 | +31,000 |
| Unemployment rate | 4.3% | 4.3% | 4.2% |
| Labour force participation | 61.8% | 61.9% | 62.2% |
| Average hourly earnings (YoY) | +3.6% | +3.5% | +3.8% |
| Healthcare jobs added | +37,000 | +76,000 | +52,000 |
| Federal government jobs | -9,000 | -18,000 | -12,000 |
| U-6 broader unemployment | 8.2% | 8.0% | 7.9% |
| Part-time for economic reasons (level) | 4.9 million | 4.4 million | 4.5 million |

| |||
Two figures from the table deserve special attention. First, the rise in part-time-for-economic-reasons workers from 4.4 to 4.9 million is a 445,000 monthly increase, the largest in roughly two years. This indicates that some workers who would prefer full-time employment are accepting reduced hours, a soft signal of weakening labour demand that headline payrolls do not capture. Second, the U-6 measure jumped to 8.2 percent while the official U-3 rate stayed at 4.3 percent, showing the same divergence: the broader gauge of underemployment is rising faster than the narrow unemployment rate.
What This Means for Policy
The Federal Reserve faces a uniquely difficult moment. The April 29 FOMC decision held the federal funds rate at 3.50 to 3.75 percent on an 8-4 vote, the most dissents in any FOMC decision since October 1992. Three members objected to language suggesting the Fed would eventually resume cutting; one (Governor Miran) wanted an immediate 25 basis point cut. Powell’s term as chair ends May 15, with Kevin Warsh confirmed as the incoming chair, an event analysed in our piece on the Powell-Warsh transition.
The April jobs report does not resolve the FOMC’s split. The 115,000 print is too soft to support a hike and too firm to demand a cut, especially with average hourly earnings still at 3.6 percent. Markets have priced no rate move at the June 16-17 meeting and continue to expect rates to remain unchanged through the rest of 2026. As Morgan Stanley’s Ellen Zentner observed, the absence of strong inflation pressure in the wage data quiets talk of a hike, but the underlying resilience of payrolls keeps cuts off the table.
The data also has implications beyond the United States. With the institutional independence of the Fed under political pressure, the new chair will face simultaneous demands for lower rates from the executive branch and demands for inflation discipline from the FOMC majority. The April labour data gives Warsh neither cover for cuts nor reason to deviate from the current hold.
For other central banks, weak US wage growth complicates the outlook. The Bank of England, which held its policy rate at 3.75 percent on March 19 and meets again on June 18, has been more dovish than the Fed. The ECB held its deposit rate at 2.0 percent on April 30, with its next decision on June 11. A US labour market that is slowing without breaking gives both institutions room to continue gradual easing without triggering large dollar moves, a dynamic that matters for global financial conditions.
MASEconomics Explains
Four economic concepts behind the April 2026 jobs report
Conclusion
The US jobs report April 2026 showed a labour market that is neither breaking nor accelerating. Payrolls grew by 115,000, the unemployment rate held at 4.3 percent, and wage growth eased to 3.6 percent year-over-year. Healthcare carried almost all of the net employment gain over the past 12 months, federal employment continued to shrink, and the participation rate fell to its lowest level since October 2021. The frozen labour market pattern that has defined activity since early 2025 remains in place, with the U-6 measure and part-time-for-economic-reasons category showing more weakness than the headline rate suggests.
Did you find this article helpful? Share it with someone who loves economics. And remember, at MASEconomics, we make complex ideas simple.