When Venezuelan annual inflation peaked at roughly 130,000 percent in 2018, a kilogram of meat in Caracas was selling for the equivalent of three months’ minimum wage at the start of the week and six months’ minimum wage by Friday. When Zimbabwean inflation reached its November 2008 peak, prices were doubling every twenty-five hours. These episodes belong to a different economic universe from the 2% annual inflation that the Bank of England, the Federal Reserve, and the European Central Bank target as price stability. The question of where ordinary inflation ends and hyperinflation begins is not just academic terminology. It marks the point at which money stops functioning as money, contracts collapse, savings evaporate, and the political and social order built on a stable currency starts to come apart. The distinction between inflation vs hyperinflation is one of degree in the data and one of kind in human experience.
Cagan’s Threshold: 50 Percent Per Month
The most influential definition of hyperinflation in modern economics comes from Phillip Cagan’s 1956 study, “The Monetary Dynamics of Hyperinflation“. Cagan examined seven episodes of extreme monetary disorder in interwar and post-war Europe and proposed a numerical threshold that has anchored the literature ever since. Hyperinflation, in Cagan’s definition, is a price increase of more than 50 percent per month, sustained for an extended period. The episode ends when the monthly rate falls below 50 percent and stays there for at least twelve months.
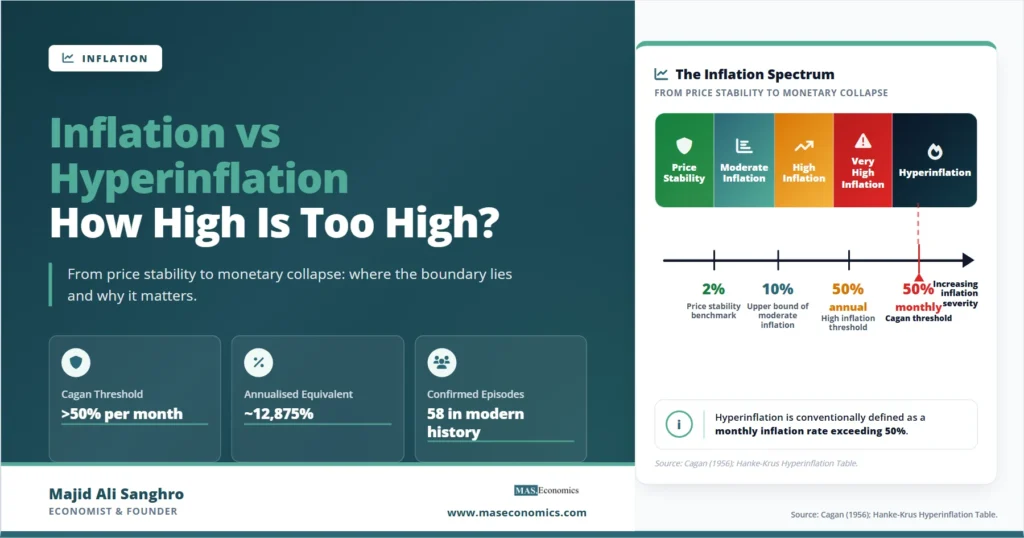
A 50 percent monthly inflation rate sounds abstract until it is annualised. Compounded over twelve months, 50 percent per month produces an annual inflation rate of approximately 12,875 percent. This is the threshold the academic literature treats as the minimum for hyperinflation. Most cases in the historical record run far above it.
Why 50 percent and not some other number? Cagan’s choice was empirical rather than theoretical. At rates below his threshold, the historical episodes he studied still showed reasonably orderly economic behaviour, with prices and wages adjusting through more or less normal channels. Above 50 percent per month, the dynamics changed character. Households began to rebalance their portfolios on a daily basis. Workers demanded payment in foreign currency or in physical goods. Firms gave up on accounting in domestic currency. The institutional infrastructure of a monetary economy started to break down. The threshold marks a phase change in the behaviour of the system, not just an extreme reading on a continuous scale.
The Full Spectrum of Inflation Regimes
Between price stability and hyperinflation lies a long stretch of inflation experience, and economists have developed informal labels for the bands within it. There is no universally agreed boundary between most of these categories, but the working classifications below are the ones used by the IMF, the World Bank, and most central bank research departments.

At the left of the spectrum sits price stability, the regime that all major central banks now treat as their objective. Annual inflation between zero and three percent is low enough that households and firms can plan, that long-term contracts remain viable, and that the three classical functions of money, medium of exchange, store of value, and unit of account all continue to work. Inflation targeting as a framework arose from the recognition that this band is not just statistically calm but institutionally productive.
Moderate inflation in the three to ten percent range is uncomfortable but not destabilising. It erodes the real return on savings, distorts the tax system, and makes investment decisions harder, but money still works. The United States in the late 1970s, the United Kingdom in the early 1980s, and a number of emerging markets in normal times all sit in this range. The Great Inflation of the 1970s is the canonical episode of advanced-economy moderate inflation, and the disinflation that ended it required deep recessions and a credible central-bank commitment, but no monetary collapse.
High inflation between ten and fifty percent per year is a different category. Indexation becomes widespread, with wages, rents, and tax brackets adjusting automatically to past inflation. Households shift their portfolios toward foreign currency, physical goods, and short-duration assets. Long-term contracts disappear. Investment falls because nominal returns become uninformative and real returns are highly uncertain. Turkey in 2022 and 2023, with annual inflation peaking above 80 percent, sits in this band.
Very high inflation between fifty and one thousand percent annually crosses into territory the IMF often classifies as a separate regime. At this point, the local currency stops functioning as a credible store of value, dollarisation accelerates, and the fiscal and monetary authorities lose much of their normal policy traction. Argentina, with annual inflation around 200 percent during much of 2024, exemplifies this band. The currency still circulates, but parallel-market exchange rates dominate everyday transactions, and savings have largely moved offshore or into hard assets.
Beyond this lies hyperinflation, defined by Cagan’s monthly rather than annual threshold. A country crossing 50 percent monthly inflation is in a category that historically has appeared only during wars, regime collapses, or extreme fiscal-monetary policy failures. The total number of confirmed hyperinflation episodes in modern history is small, and they cluster in distinct historical periods.
The Documented Hyperinflation Episodes
The Hanke-Krus Hyperinflation Table, the most authoritative inventory of confirmed hyperinflation episodes, lists fifty-eight cases that have met Cagan’s threshold since reliable price data began. Most occurred in three clusters: the immediate aftermath of the First World War (Germany, Austria, Hungary, Poland, the Soviet Union), the post-Second World War period (Hungary, Greece, China, Taiwan), and the post-Cold War transition (Yugoslavia, Zimbabwe, Bolivia, and several former Soviet states in the early 1990s). Venezuela in 2016 to 2019 represents the most recent confirmed case.
The numerical extremes are difficult to grasp. Hungary in 1946 holds the record: prices doubled approximately every fifteen hours at the peak, and the highest-denomination banknote ever printed, the 100 quintillion pengő note, was issued during the episode. Germany in 1923 saw prices rise by a factor of one trillion between 1914 and the stabilisation in November 1923; the famous photographs of Germans burning banknotes for warmth or wallpapering rooms with worthless currency date from this period. Yugoslavia in 1994 experienced 313 million percent monthly inflation at the peak, with prices doubling every thirty-four hours. Detailed case studies of Weimar Germany, Zimbabwe, and Venezuela explore the mechanisms behind each of these episodes.
What unites the historical record is not just the speed of price increases but the shared underlying mechanism. In every confirmed case, hyperinflation began with a fiscal crisis that the government attempted to resolve by printing money. The Reichsbank in 1923 was financing reparations and government deficits with newly issued currency. The Reserve Bank of Zimbabwe in the late 2000s was financing government salaries, war veterans’ pensions, and an unfunded land-redistribution programme. The Venezuelan central bank was monetising deficits that had grown to roughly 30 percent of GDP. Once monetary financing of fiscal deficits crosses a threshold, inflation expectations unanchor, and the dynamics become self-reinforcing. Higher inflation reduces the real value of seigniorage revenue, requiring even faster money creation to finance the same real deficit, which generates higher inflation. This is the seigniorage trap that defines every modern hyperinflation.
The Quantitative Difference
A simple table makes the gap between ordinary inflation and hyperinflation concrete.
| Regime | Annual rate | Monthly equivalent | Representative episode |
|---|---|---|---|
| Price stability | 0–3% | ≈ 0–0.25% | United States, 2010–2019 |
| Moderate inflation | 3–10% | ≈ 0.25–0.8% | United States, 1973–1981 |
| High inflation | 10–50% | ≈ 0.8–3.4% | Turkey, 2022–2023 |
| Very high inflation | 50–1,000% | ≈ 3.4–22% | Argentina, 2024 |
| Hyperinflation (Cagan) | ≥ 12,875% | ≥ 50% | Zimbabwe, 2008 (peak 79.6 billion % monthly) |
| Extreme hyperinflation | Astronomical | ≥ 1,000% | Hungary, July 1946 (peak ~4.19 × 10¹⁶ % monthly) |
|
Source: IMF World Economic Outlook database; Hanke-Krus Hyperinflation Table; national statistical agencies.
|
|||
The compounding mathematics behind Cagan’s threshold is worth pausing on. A price level rising at 50 percent per month doubles every sixty days and rises by a factor of approximately 130 over a single year. At 100 percent per month, the doubling time is one month, and the annual factor exceeds 4,000. At Zimbabwe’s November 2008 peak rate of 79.6 billion percent per month, the doubling time collapsed to roughly twenty-five hours. At Hungary’s July 1946 peak, it was around fifteen hours. These are not statistical curiosities; they describe an economy in which the unit of account changes meaningfully between morning and evening.
How Money Fails During Hyperinflation
Inflation in the ordinary sense reduces the real value of money slowly enough that money can still perform its three economic functions. Hyperinflation strips money of one function after another in a recognisable sequence.
The first function to fail is the store of value. Once prices rise faster than savings accounts can credibly compensate, holding cash or domestic-currency deposits becomes a guaranteed loss. Households convert wages into goods or foreign currency within hours of receiving them. The classic image from the Weimar episode is the worker’s wife who waited at the factory gates at lunchtime to collect her husband’s morning pay, ran to the shops, and bought whatever was available before the afternoon price adjustment. The German experience of 1923 embedded a cultural memory of currency collapse that still shapes Bundesbank policy a century later.
The second function to fail is the unit of account. When prices change daily or hourly, posting them in domestic currency becomes pointless. Restaurants in Zimbabwe in 2008 wrote prices on chalkboards and updated them several times per service. Argentine retailers in 2024 quoted prices in dollars and converted at the parallel exchange rate at the moment of transaction. Accounting in the local currency becomes meaningless, and firms shift their internal books to a hard-currency reference.
The last function to fail is the medium of exchange. As long as the local currency can be used to buy bread within minutes of receiving it, it retains some transactional value. But in the final phase of severe hyperinflation, even this collapses. Sellers refuse the currency. Transactions move to barter, foreign currency, or commodity money. At this point, the domestic currency has effectively ceased to be money in any functional sense. Stabilisation typically requires either a currency reform (Germany’s introduction of the Rentenmark in 1923, Zimbabwe’s abandonment of its own currency in 2009) or a credible institutional change that re-anchors expectations.
The Qualitative Threshold
The reason Cagan’s 50-percent-per-month rule has endured is not that the number itself is theoretically deep. It is that the behaviour of the economy changes qualitatively somewhere in that neighbourhood. Below the threshold, even at very high inflation, people still hold the domestic currency for transactions, accept long contracts with indexation clauses, and treat the central bank’s announcements as informative. Above the threshold, the institutional infrastructure of monetary exchange unravels.
The phase change has three reinforcing components. Expectations become forward-looking and panicky rather than backward-looking and adaptive. Money demand collapses as households dump cash as fast as possible, which accelerates inflation because the same nominal money supply is now chasing a smaller real money demand. Fiscal capacity erodes because tax revenue is collected with a lag and is in nominal terms, while government spending must be revised upward in real time. This is the Olivera-Tanzi effect: real fiscal revenue collapses precisely when the government most needs it.
Note. The 50 percent monthly threshold is a working definition, not a natural constant. Some authors propose lower thresholds (30 percent per month, or sustained 100 percent annual inflation) and the IMF uses different cut-offs for different purposes. The qualitative phase change in monetary behaviour, however, occurs reliably in the same general region.
How Inflation Becomes Hyperinflation
The historical evidence is clear that hyperinflation does not arise from purely external shocks such as oil price spikes, supply chain disruptions, or geopolitical events. These shocks can push annual inflation into double digits, but they do not produce monthly inflation in excess of 50 percent. Every confirmed hyperinflation episode in the modern record has involved sustained monetary financing of fiscal deficits, usually in the context of regime collapse or institutional breakdown.
The pattern proceeds in identifiable stages. First, a fiscal crisis emerges that the government cannot resolve through ordinary taxation or borrowing. The crisis may be triggered by war reparations (Weimar), a collapsing export sector (Venezuela), a politically driven spending programme (Zimbabwe’s land redistribution), or the breakdown of a federal state (Yugoslavia). Second, the central bank begins financing the deficit by purchasing government debt, expanding the monetary base. Third, inflation rises, eroding the real value of tax revenue and the existing money supply, which forces the central bank to expand the monetary base further to finance the same real fiscal deficit. Fourth, inflation expectations unanchor, money demand collapses, and the dynamic becomes self-reinforcing.
Modern central bank independence and the separation of fiscal and monetary policy exist precisely to break this chain. A central bank that cannot legally purchase government debt directly, or that has a credible mandate to refuse, cannot be drawn into the dynamic that produces hyperinflation. The historical literature on inflation is essentially unanimous that institutional architecture, not technical monetary policy, determines whether a country crosses the threshold into hyperinflation.
Why Advanced Economies Stay Below the Threshold
It is worth being clear about why the United States, the United Kingdom, the euro area, and Japan are extremely unlikely to experience hyperinflation, even when inflation rises sharply for cyclical reasons. The 2021 to 2023 inflation spike in the advanced economies, which peaked at around 9 to 11 percent annual rates, was a serious policy episode but never approached Cagan’s threshold and never showed any tendency to do so.
The reasons are structural. Advanced-economy central banks are statutorily independent, with explicit mandates focused on price stability. Their balance sheets are large but their operations are constrained by transparent rules and parliamentary oversight. Fiscal deficits are financed in deep capital markets where the bond price provides a real-time signal of fiscal sustainability. Most importantly, inflation expectations remain anchored: surveys of households, firms, and financial markets in advanced economies continued to show medium-term expectations near 2 percent even at the peak of the 2022 inflation surge. The institutional infrastructure that defines an advanced economy is precisely the infrastructure that prevents the unanchoring dynamic at the core of every hyperinflation.
The danger zone, when it exists, lies in emerging markets with weak fiscal institutions, dependent central banks, and a history of monetary financing. Argentina, Venezuela, Turkey, and Zimbabwe all share this profile to varying degrees. Even within this group, full hyperinflation remains rare. Argentina’s annual inflation of around 200 percent in 2024 was severe by any standard but stayed well below Cagan’s threshold. The path from very high inflation to hyperinflation requires a further breakdown that most countries, even troubled ones, manage to avoid. Argentina’s history of repeated debt crises and inflation episodes illustrates how a country can spend decades at the threshold without crossing it.
How Hyperinflation Episodes End
Hyperinflation always ends. The historical record contains no episode that continued indefinitely, because the dynamics are too destructive for the underlying society to sustain. The terminating mechanism, however, varies.
The most common path is currency reform combined with a fiscal-institutional change that restores the credibility of the monetary anchor. Germany ended the 1923 hyperinflation by introducing the Rentenmark, backed nominally by mortgages on German industrial and agricultural assets, and by ceasing direct central bank financing of the government. The change worked because it was accompanied by a credible fiscal adjustment and a political consensus that hyperinflation could not be allowed to continue. The Reichsmark, introduced shortly afterward, became one of the more stable currencies of the late 1920s. Hungary in 1946 introduced the forint after the pengő had reached its astronomical peak; the new currency held its value because the fiscal-monetary regime that produced the hyperinflation was no longer in place.
The alternative path is dollarisation, formal or informal. Zimbabwe abandoned its own currency in 2009 and adopted the US dollar and South African rand for transactions, a regime that held until the gradual reintroduction of a domestic currency in 2019. Ecuador adopted the dollar formally in 2000 after a banking crisis and currency collapse. El Salvador dollarised in 2001. Dollarisation ends hyperinflation immediately because it removes monetary policy from the domestic authorities; the inflation rate becomes whatever the US Federal Reserve produces.
The two paths share a feature. Ending hyperinflation requires removing the underlying fiscal-monetary dynamic that produced it. Without that, any new currency or stabilisation programme fails within months. With it, even hyperinflations of catastrophic magnitude can be stopped in a few weeks.
Implications for Current Policy
The distinction between inflation and hyperinflation matters for current policy because public discourse often blurs the two. Headlines that warn of “hyperinflation” when annual inflation reaches 7 or 8 percent in an advanced economy are using the term loosely. The actual phenomenon is rare, requires a particular set of institutional preconditions, and has never occurred in a country with an independent central bank operating under modern monetary policy frameworks. Recognising this is not complacency; it is calibration. The genuine policy challenge of bringing 7 percent inflation back to 2 percent is serious enough on its own terms without invoking the spectre of Weimar Germany or Zimbabwe.
The distinction also matters for institutional design. The fact that hyperinflation is institutionally driven rather than technically driven tells us where defences should be built. Independent central banks, legal restrictions on monetary financing of deficits, transparent fiscal rules, and credible commitments to inflation targets are the architecture that keeps countries away from the threshold. These defences are unglamorous, but the historical record suggests they work. The countries that have spent the last forty years building this infrastructure have not produced a single hyperinflation episode. The countries that have not built it have produced most of the modern cases.
Explains
Three ideas that frame the inflation-hyperinflation distinction
Explore more analysis of inflation, monetary economics, and the institutions that shape price stability.
Explore the MASEconomics BlogConclusion
The boundary between ordinary inflation vs hyperinflation is conventionally drawn at 50 percent per month, following Cagan’s 1956 definition. This is a working threshold rather than a natural constant, but it marks the point at which the behaviour of an economy changes qualitatively rather than just quantitatively. Below it, money continues to function, contracts continue to be written, and central banks retain policy traction. Above it, the institutional infrastructure of monetary exchange begins to dissolve, and the social experience of holding currency becomes one of constant loss.
The historical record contains a relatively small number of confirmed hyperinflation episodes, and they share a common cause: sustained monetary financing of fiscal deficits in the absence of independent monetary institutions. The path from ordinary inflation to hyperinflation requires this institutional breakdown, not merely a high inflation rate. Distinguishing the two regimes accurately is not a semantic exercise. It changes how policy responses are designed, how risks are communicated to the public, and how citizens understand what is and is not at stake when inflation rises.
Frequently Asked Questions
What is the difference between inflation and hyperinflation?
Inflation is a sustained rise in the general price level, usually measured in annual percentage terms. Hyperinflation is defined by Phillip Cagan’s 1956 threshold of more than 50 percent inflation per month, equivalent to roughly 12,875 percent per year. The difference is not just numerical; above the threshold, the institutional functioning of money breaks down, with prices changing daily or hourly and households abandoning the domestic currency.
How high does inflation have to be to count as hyperinflation?
The standard academic definition, due to Cagan, is 50 percent or more per month, sustained over a period of months. Compounded over a year, this is approximately 12,875 percent annual inflation. Some authors propose lower thresholds, but the qualitative phase change in monetary behaviour reliably appears in the 50 percent monthly region.
What is the worst hyperinflation in history?
Hungary in July 1946 holds the record. At the peak, daily inflation reached approximately 207 percent, meaning prices doubled every fifteen hours. Cumulative inflation during the episode reached astronomical levels, and the Hungarian government issued the highest-denomination banknote ever printed, the 100 quintillion pengő note, before introducing the forint to stabilise the currency.
Can advanced economies like the United States experience hyperinflation?
It is extremely unlikely under current institutional arrangements. Every confirmed hyperinflation episode in the modern record has involved sustained monetary financing of fiscal deficits in the absence of central bank independence. The institutional architecture of the Federal Reserve, the Bank of England, the European Central Bank, and the Bank of Japan, including legal restrictions on direct monetary financing and credible inflation-targeting mandates, prevents the dynamic that produces hyperinflation.
How does hyperinflation end?
Through either a currency reform combined with a credible fiscal-institutional change (Germany 1923, Hungary 1946), or through dollarisation (Zimbabwe 2009, Ecuador 2000). Both paths require removing the underlying mechanism that produced the hyperinflation, typically by ending direct monetary financing of government deficits. Without that, a new currency fails within months. With it, even severe hyperinflations can be halted in weeks.
Is high inflation the same as hyperinflation?
No. High inflation, typically ten to fifty percent annually, is uncomfortable and economically damaging but leaves money functioning as money. Households and firms still hold the currency, write contracts in it, and treat the central bank’s announcements as informative. Hyperinflation, by Cagan’s definition, requires monthly inflation above 50 percent and produces qualitative changes in monetary behaviour that do not occur at lower rates.
Thanks for reading! If you found this helpful, share it with friends and spread the knowledge. Happy learning with MASEconomics