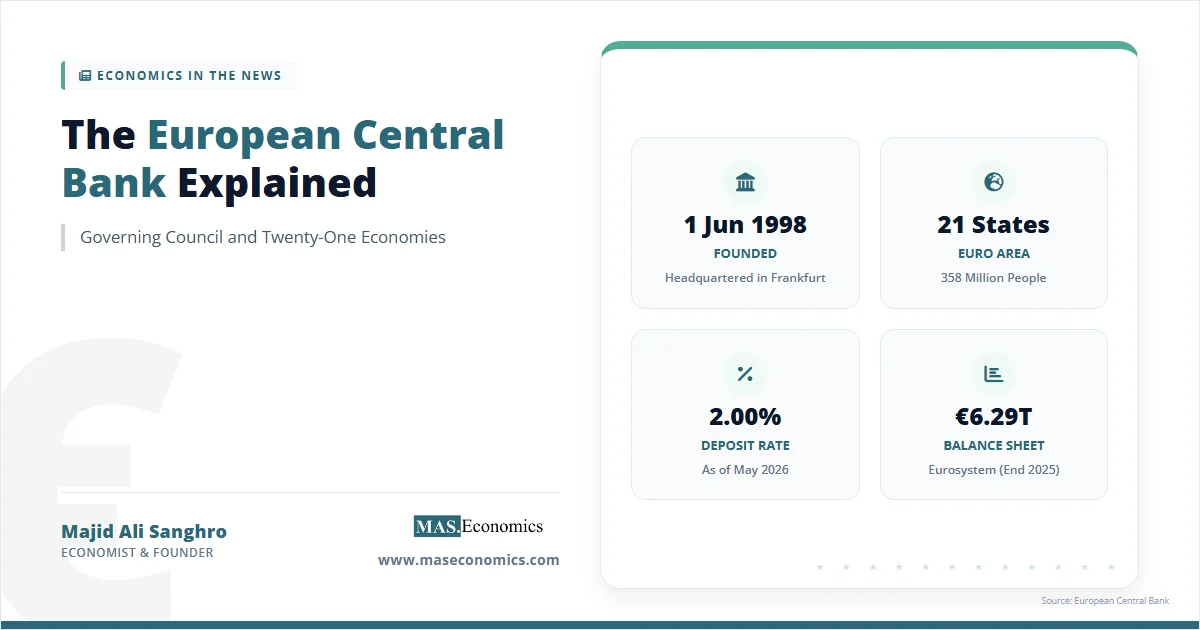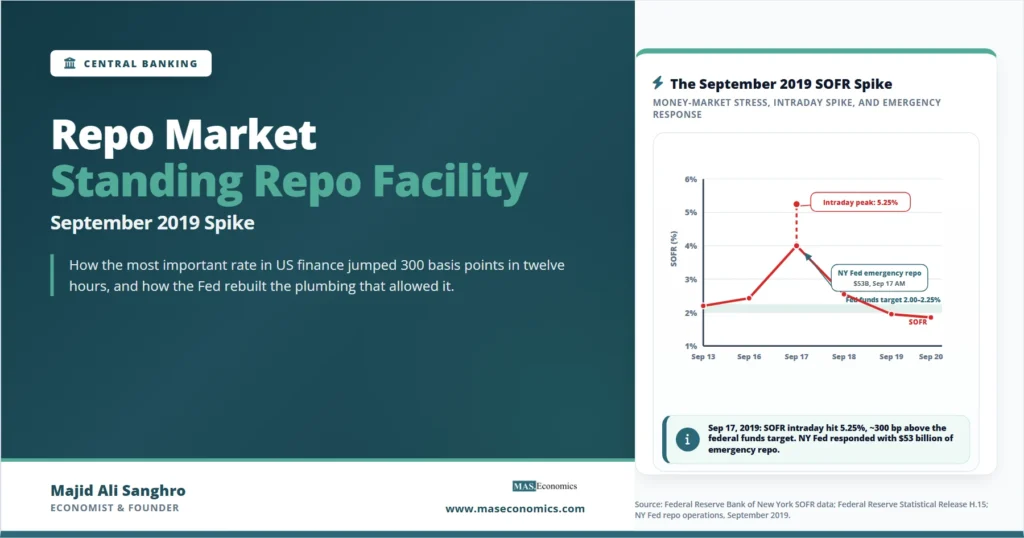
On Tuesday, September 17, 2019, the secured overnight financing rate, SOFR, traded intraday at 5.25 percent, roughly 300 basis points above the Federal Reserve’s federal funds rate target of 2 to 2.25 percent. The New York Fed’s Open Market Trading Desk launched emergency repo operations that morning, the first since 2008, injecting $53 billion to restore order. The episode exposed a fragility in the plumbing of US monetary policy that the repo market standing repo facility, introduced in July 2021, was designed to permanently address.
The repo market, where trillions of dollars are lent overnight against Treasury collateral, is the foundation for the interest rates that anchor global finance. When that market seizes, the entire monetary transmission system is at risk. The standing repo facility acts as a permanent ceiling, ensuring that no solvent counterparty needs to pay more than the administered rate to fund itself overnight.
What the Repo Market Is
A repurchase agreement, almost always shortened to repo, is a short-term collateralized loan. A cash borrower sells a security, typically a US Treasury bond, to a cash lender at one price, with an agreement to repurchase the same security at a slightly higher price the next day. The price difference is the interest. From the lender’s perspective, the transaction is economically equivalent to a one-day secured loan: cash goes out today, cash comes back tomorrow, and during the intervening night the lender holds the Treasury as security against default. If the borrower fails to repurchase, the lender keeps the security and sells it. Because the underlying collateral is normally the safest asset in the world, repo rates are typically the lowest interest rates available in any major market.
The market is enormous. US Treasury repo daily volume sits between $4 trillion and $7 trillion, depending on the measurement source. The Treasury repo market is the primary mechanism by which money market funds, banks, hedge funds, broker-dealers, the Federal Home Loan Banks, and the Federal Reserve itself manage their daily cash positions. A pension fund with excess cash overnight lends it in repo. A hedge fund financing a Treasury position borrows cash via repo. A bank meeting a regulatory liquidity requirement holds Treasuries that it can repo if needed. The rate at which all of this trading occurs, the SOFR, is the post-LIBOR benchmark used to price about $400 trillion of financial contracts globally.
Because SOFR sits at the very base of the rate structure, anything that pushes it materially away from the Federal Reserve’s policy target propagates upward through the whole system. The Fed’s effective control over the federal funds rate, which is the rate it formally targets, depends in part on SOFR staying anchored close to the target. When SOFR moves, federal funds usually follow. When SOFR breaks, federal funds break with it.
The September 2019 Spike
The spike was not a black swan. It was the convergence of three predictable pressures that the market had been signaling for weeks, none of which the Fed or the dealers had taken seriously enough.
The first pressure was corporate tax payments. September 16 was a quarterly corporate tax deadline. Treasury cash balances at the Fed rose by roughly $35 billion that day as corporations transferred funds from their bank accounts to the Treasury’s General Account. Each dollar of corporate tax payment removed one dollar of bank reserves from the system, because the Treasury’s payment account sits on the Fed’s balance sheet rather than in the commercial banking system. The second pressure was a Treasury auction settlement of around $54 billion, which similarly drained reserves as dealers paid the Treasury for newly issued securities. The third pressure was the ongoing quantitative tightening program, which had reduced the Fed’s balance sheet by about $700 billion since October 2017. Reserves in the banking system had fallen from a peak of $2.8 trillion to about $1.4 trillion by mid-September 2019.
The combination drained reserves below what banks needed to clear payments smoothly. Reserves fell from about $1.45 trillion on September 13 to under $1.40 trillion by September 16. The repo market, normally the safety valve where banks could borrow cash against Treasury collateral, found itself with willing borrowers but no lenders at the prevailing rate. SOFR, which had been printing at 2.20 percent at the start of the week, opened at 2.43 percent on September 16, traded as high as 5.25 percent intraday on September 17, and only normalized after the Fed began emergency operations.
| Date | Event | SOFR (approx.) | Reserve impact |
|---|---|---|---|
| September 13, 2019 | Reserves at $1.45 trillion. SOFR normal. | 2.20% | Stable |
| September 16, 2019 | Corporate tax payments + Treasury auction settlement drain reserves. | 2.43% | Reserves fall to $1.39T |
| September 17, 2019 (intraday) | SOFR spikes. NY Fed announces $75B emergency overnight operations. | up to 5.25% | Liquidity injected |
| September 18, 2019 | FOMC meeting decision overshadowed by repo turmoil. Operations continue. | back to 2.55% | $75B daily ops continue |
| October 2019 | Fed begins T-bill purchases at $60B per month to rebuild reserves. | Returns to target range | Reserves grow |
| 2020 – 2021 | Pandemic and QE programs push reserves above $4 trillion. | Near target | Reserves at $4T+ |
| July 28, 2021 | Federal Reserve announces the Standing Repo Facility (SRF). | Stable | Permanent backstop |
| Net outcome | Institutional fix: SRF provides permanent overnight repo backstop. | Volatility contained | Operating framework upgraded |
|
Source: Federal Reserve Bank of New York Open Market Operations data; FOMC statements September 18, 2019 and July 28, 2021; Federal Reserve H.4.1 statistical release.

|
|||
The chart below shows the SOFR path through the episode. The first thing to notice is the speed of the move: from a stable 2.20 percent on Friday, September 13, to an intraday high of 5.25 percent on Tuesday, September 17, then back to 2.55 percent by Wednesday morning. The market was dysfunctional for less than two full trading days, but the disruption was severe enough to make the FOMC meeting that began on September 17 secondary news.
Three features of the chart matter. First, the spike was contained to one trading day. The market normalized within twenty-four hours of the Fed’s intervention. Second, the intraday peak was much higher than any settled daily print. The 5.25 percent number captures the most stressed moment of the day rather than the day’s overall trading. Third, after the Fed began daily operations on September 17, SOFR settled within the federal funds target band and stayed there for the remainder of the week, demonstrating that the underlying market had not become permanently dysfunctional. It had simply run out of cash for a short period and needed a credible lender of last resort to restore equilibrium.
Why Reserves Suddenly Became Scarce
The deeper question the spike forced the Fed to confront was why the system had become so brittle. In 2010 or 2012, when reserves were above $2.5 trillion, an equivalent set of tax-and-auction drains would have been absorbed without notice. By September 2019, the same drains pushed SOFR to 5.25 percent. The Federal Reserve Bank of New York published a detailed post-mortem in late 2019, which, combined with subsequent staff work, has produced a fairly clear understanding of what changed.
The first change was the level of reserves itself. The Fed’s quantitative tightening program ran from October 2017 through July 2019, removing about $700 billion from the balance sheet by allowing maturing securities to roll off rather than reinvesting them. Each dollar of QT removed approximately one dollar of bank reserves. The FOMC had projected that the long-run demand for reserves was around $1 trillion, leaving comfortable room above that floor at the $1.4 trillion level. The September spike showed that the actual demand-for-reserves curve was steeper than the projection assumed, and that scarcity bit at levels well above $1 trillion.
The second change was the post-crisis bank regulatory regime. Large US banks now face daily liquidity coverage ratios, intraday liquidity requirements, supplementary leverage ratios, and resolution-planning constraints that did not exist before 2010. Each of these regulations effectively raises the demand for reserves by making it more costly for banks to lend their reserves out, even at attractive interest rates, because the lending reduces measured liquidity buffers or expands leverage on the balance sheet. The pre-crisis assumption that any bank with excess reserves would arbitrage them into the repo market was no longer reliable. Several large banks held reserves they could lend on paper, but would not lend in practice because of the regulatory cost of doing so.
The third change was the structure of repo intermediation. Before 2008, the repo market relied heavily on broker-dealer balance sheets to intermediate cash between lenders and borrowers. The supplementary leverage ratio, adopted under Basel III, increased the cost of using dealer balance sheets, particularly during quarter-end and year-end reporting dates. Money market funds had grown substantially as cash lenders, but they could only lend in repo through dealer counterparties. When dealer balance sheets were constrained, the cash that money funds wanted to lend could not reach the borrowers who wanted to borrow it, even at high spreads above the policy rate.
The September 2019 spike was not a liquidity crisis in the classic sense of fearful counterparties refusing to lend. It was a plumbing crisis: cash was available, collateral was available, but the intermediation channels that connected them were too narrow to handle the demand on those particular days. The post-mortem made it clear that the Fed’s understanding of how the repo market worked at scale was incomplete.
The Standing Repo Facility
The immediate response to the September 2019 episode was daily emergency repo operations conducted by the New York Fed’s Open Market Trading Desk. These continued through the early months of the pandemic, then were largely paused as quantitative easing flooded the system with reserves and SOFR pressure disappeared. The pandemic-era flood was so substantial, with reserves rising from $1.5 trillion to over $4 trillion between March 2020 and early 2021, that the question of how to handle scarcity became academic for a while. But policymakers had learned the lesson, and the FOMC was determined to put a permanent institutional fix in place before reserves became scarce again.
On July 28, 2021, the Federal Reserve announced the Standing Repo Facility. The SRF is a permanent overnight repo backstop available to a defined set of counterparties, allowing them to borrow cash from the Fed against eligible Treasury, agency, or mortgage-backed securities collateral at a predetermined administered rate. The current rate is set at the top of the federal funds target range, which means SRF acts as a ceiling on overnight rates: if a counterparty can borrow from the Fed at that rate against high-quality collateral, no one needs to lend in the market at a higher rate. The facility opens daily for two operating windows, one in the morning and one in the afternoon.
The SRF differs from the emergency operations of 2019 in three important ways. First, it is permanent and rules-based rather than discretionary. Counterparties know exactly when it will be open, at what rate, against what collateral, and in what size. The 2019 operations had to be improvised, announced morning by morning, and the market never quite knew what to expect. Second, the counterparty pool is broader, including primary dealers and a growing set of depository institutions. Third, the rate is administered rather than auction-determined, meaning the Fed sets the rate and accepts all submitted bids up to the facility’s overall capacity.
| Element | SRF Specification | Operational Role |
|---|---|---|
| Rate | Set at the top of the federal funds target range | Acts as a ceiling on overnight repo rates |
| Collateral | US Treasury, agency debt, agency MBS | Highest-quality eligible securities |
| Counterparties | Primary dealers plus eligible depository institutions | Broader access than 2019 emergency operations |
| Operating window | Morning and afternoon daily windows | Allows intraday liquidity management |
| Term | Overnight | Same-day liquidity provision |
| Aggregate capacity | Sized at $500 billion in 2024 | Far larger than any plausible single-day need |
| Trigger | Automatic, on counterparty demand | No discretionary approval needed |
| Net policy effect | Permanent ceiling preventing repo market dysfunction | Operating framework hardened |
|
Source: Federal Reserve Board press release July 28, 2021; FOMC implementation note; Federal Reserve Bank of New York SRF terms of operation.
|
||
The SRF’s first real test came in late 2022 and 2023 as the Fed’s renewed quantitative tightening program once again began draining reserves. Through most of that period, the SRF saw zero or nominal usage because reserves remained ample. Modest usage began in mid-2024 as reserves crossed below $3.2 trillion. By 2025, the facility was being used episodically on quarter-end dates, exactly the kind of stress points where bank regulatory frictions are most binding. The total volumes have remained modest, in the tens of billions rather than hundreds of billions, which suggests the facility is functioning as designed: a ceiling that activates exactly when it needs to and stays dormant otherwise.
Lessons for the Federal Reserve
The institutional lessons of September 2019 extend well beyond the specific repo facility that resulted. Three broader changes to the Fed’s operating framework can be traced directly to the episode.
The first change is the Fed’s understanding of the demand for bank reserves. The pre-2019 view was that there was a relatively flat demand curve for reserves at all levels above a low floor, perhaps $500 billion to $1 trillion. The post-2019 view, supported by detailed staff work, is that the demand curve is steeper than this and that scarcity can bite at levels much higher than $1 trillion. The current operational framework targets a much more comfortable buffer above estimated scarcity, with reserves now typically held in the $3 trillion to $3.5 trillion range. Whether $3 trillion is the right number for 2026 is itself contested, but the principle that the floor should sit well above the danger zone is now firmly established.
The second change is in how the Fed thinks about monetary policy tools as a system rather than a collection of instruments. Before 2019, the federal funds rate target was the policy variable, and the open market operations were the mechanism for hitting it. After 2019, the Fed treats SOFR, the federal funds rate, IORB (interest on reserve balances), ON RRP (overnight reverse repo), and the SRF as a coordinated suite. The discount window remains the formal lender-of-last-resort tool, but the SRF, ON RRP, and IORB together establish the corridor in which money market rates trade. Movements in any of them can be used to manage the overall rate structure.
The third change is in the political economy of central bank operations. The September 2019 spike attracted criticism from members of Congress and the financial press about the Fed’s apparent surprise. The institutional response was to be much more transparent about how the operating framework worked, to publish more data on reserves, and to communicate proactively about the rationale for the SRF’s design. The current Fed publishes daily H.4.1 statistical releases and other data that allow analysts to track reserves and operations in close to real time. This is part of the broader trend toward central bank transparency that has shaped forward guidance and SEP communication over the past decade.
Limits of the SRF
The SRF is a robust ceiling for normal operations, but several genuine limits remain.
The facility cannot remove the underlying frictions in bank regulation. The leverage ratio constraints, liquidity coverage requirements, and intraday liquidity demands that made the repo market brittle in 2019 are still in place. The SRF means these frictions no longer translate into rate spikes, but it does not mean the frictions have gone away. The Fed has worked with bank regulators on calibrations that better recognize the dynamics of the repo market, but the underlying regulatory structure is unchanged from its 2019 form.
The facility cannot address potential dysfunction in markets it does not cover. The SRF accepts Treasury, agency, and agency MBS collateral. It does not accept corporate paper, asset-backed securities, or other private collateral. If a stress episode were to emerge in markets where the SRF cannot lend, the facility would not help directly. The pandemic-era Money Market Mutual Fund Liquidity Facility, the Primary Dealer Credit Facility, and similar emergency tools were designed for exactly these situations, but they are explicitly emergency tools rather than permanent ones.
The facility cannot eliminate the underlying scarcity if reserves fall too far. If the Fed’s balance sheet were to shrink to levels where reserves are deeply scarce, the SRF would activate constantly, the rate on it would be paid every day, and the facility would essentially become a permanent source of cheap funding for counterparties. This is not a desirable equilibrium. The intent is for the SRF to be a backstop that rarely activates, not a primary funding source. The Fed must therefore continue to manage the balance sheet so that reserves remain ample by default.
Broader Operating Framework
The repo market, the SRF, the federal funds market, and the Fed’s interest-on-reserves regime are all components of a single integrated operating framework. The framework has multiple names depending on the speaker. Fed officials often call it the “ample reserves regime,” in contrast to the pre-2008 “scarce reserves regime” in which the Fed actively managed reserve levels to hit its target. Academics sometimes call it the “floor system” because the Fed sets the floor on overnight rates through interest on reserves and then uses the SRF as a ceiling.
The framework choice has implications for how the broader quantitative easing and quantitative tightening tools interact with day-to-day rate management. Under the ample reserves regime, the Fed does not need to fine-tune reserves to hit its target each day. The interest paid on reserves anchors the bottom of the rate corridor, and the SRF anchors the top. Open market operations are still conducted, but they are less about achieving the target rate from one day to the next and more about managing the overall size and composition of the balance sheet.
This is one of the reasons why the Fed’s quantitative tightening program from 2022 to 2024 proceeded with little day-to-day turbulence in money markets, despite drawing down reserves by over $1.5 trillion. The lessons of September 2019 had been institutionally absorbed. The Fed stopped the QT program at higher reserve levels than it had targeted in the prior cycle, deliberately to avoid revisiting the conditions that produced the spike. The SRF sat in place, ready to backstop any disturbance. As of late 2025, the framework had been stress-tested without breaking.
Explains
Three concepts behind the repo market and the SRF
From repo market plumbing to the broader toolkit of central bank operations and the Fed’s ample reserves framework.
Explore the MASEconomics BlogConclusion
The repo market standing repo facility that the Federal Reserve built in 2021 was the direct institutional response to the September 2019 episode that revealed the brittleness of the post-crisis money market plumbing. The episode itself was over within days, but the lessons were structural: reserves can become scarce at levels much higher than the Fed had assumed, bank regulation creates real frictions that prevent the repo market from clearing through private intermediation, and overnight funding markets need a credible permanent ceiling to prevent stress episodes from propagating into the broader rate structure. The SRF was the institutional answer to all three lessons.
Four years after the SRF’s introduction, it has been tested intermittently and has performed as designed. Usage has been modest, rates have stayed within their targeted range, and the broader monetary transmission system has not produced another episode comparable to September 2019. The facility’s next major test will come during the next deep balance-sheet reduction cycle, when reserves are pushed back toward scarcity. Some new structural wrinkle is likely to emerge because the financial system continually evolves, and the Fed’s operating framework will continue to develop alongside it.
Frequently Asked Questions
What is the repo market?
The repo market is the wholesale short-term funding market where cash is lent overnight against high-quality collateral, typically US Treasuries. A borrower sells a security to a lender with an agreement to repurchase it the next day at a slightly higher price; the price difference is the interest. US Treasury repo daily volume is between $4 trillion and $7 trillion, making it one of the largest financial markets in the world.
What caused the September 2019 SOFR spike?
Three predictable pressures converged. Corporate tax payments on September 16 drained roughly $35 billion in reserves into the Treasury’s account at the Fed. A Treasury auction settlement of around $54 billion drained reserves as dealers paid for new securities. And the Fed’s quantitative tightening program had already reduced total reserves from $2.8 trillion in 2017 to about $1.4 trillion by mid-September 2019. Combined with regulatory frictions that limited how easily banks could lend reserves into the repo market, the drains pushed SOFR to an intraday high of 5.25 percent.
What is the Standing Repo Facility?
The Standing Repo Facility, or SRF, is a permanent Federal Reserve facility through which approved counterparties can borrow cash overnight from the Fed against Treasury, agency debt, and agency mortgage-backed securities collateral, at an administered rate set at the top of the federal funds target range. It was announced on July 28, 2021 and acts as a ceiling on overnight repo rates by providing a guaranteed cash source whenever market rates would otherwise spike above the SRF rate.
Why was the SRF needed?
The September 2019 episode showed that the repo market could break down even when no fundamental credit problem existed. Bank regulatory constraints and reduced dealer balance sheet capacity meant that excess cash held by some institutions could not always reach the borrowers who needed it. A permanent backstop where the Fed itself stood ready to lend cash against safe collateral at a fixed rate eliminates this gap by ensuring that no rational borrower needs to pay more than the SRF rate.
Has the SRF been used much since 2021?
Usage has been modest. The SRF saw essentially zero utilization from 2021 through 2023 because pandemic-era reserves were so abundant that overnight rates stayed comfortably within the target range. Usage began to pick up in 2024 as quantitative tightening drained reserves, particularly on quarter-end dates when regulatory frictions tighten most. By 2025, peaks usage was in the tens of billions of dollars on stress dates, suggesting the facility is acting as a ceiling but not a primary funding source.
Could another September 2019 spike happen?
The SRF makes another spike of the September 2019 magnitude very unlikely under similar conditions, because counterparties can always borrow from the Fed at the SRF rate rather than pay materially more in the market. However, the SRF only covers Treasury and agency collateral. Stress in other funding markets, such as commercial paper or repo against non-eligible collateral, could still produce dislocations that the SRF cannot directly address. The 2019 lessons have hardened the core of the system but not the entire perimeter.
Thanks for reading! If you found this helpful, share it with friends and spread the knowledge. Happy learning with MASEconomics