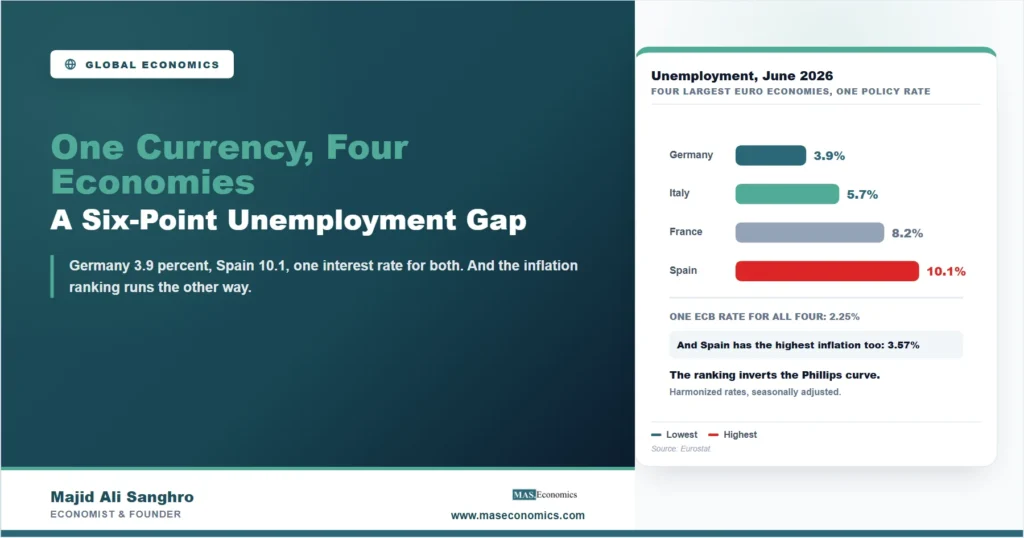
A person looking for work in Spain this summer faces a 10.1 percent unemployment rate. The same person in Germany faces 3.9 percent. Both economies use the same money, answer to the same central bank, and live under the same 2.25 percent interest rate. The euro area unemployment average of 6.3 percent that appears in headlines describes neither of them. It is the midpoint of a 6.2-point spread that a single monetary policy has to serve with one number.
That spread is not a statistical curiosity. It is the oldest argument about the euro, running since before the currency existed, and in June 2026 it is unusually easy to see because the four largest euro economies have published the same month, on the same definitions, and the rankings refuse to line up with any simple story.
Four Economies, One Month, One Interest Rate
Here is the grid for June 2026. Every figure comes from Eurostat’s harmonized series, so the countries are measured the same way, and the inflation rates are computed from the same index family the European Central Bank targets.
| Economy | Unemployment rate | Inflation, HICP annual rate |
|---|---|---|
| Germany | 3.9% | 2.35% |
| France | 8.2% | 2.02% |
| Italy | 5.7% | 2.98% |
| Spain | 10.1% | 3.57% |
| Euro area | 6.3% | 2.73% |

|
||
One deposit rate, 2.25 percent, applies to all four rows. The European Central Bank cannot set a Spanish rate and a German rate, because there is one euro. So the rate that is right for the average is, almost by construction, wrong for the extremes: loose relative to an economy at 3.9 percent unemployment, tight relative to one at 10.1.
The gap between Germany and Spain, 6.2 percentage points, is wider than the entire range most single countries cover in a decade. For comparison, American unemployment has moved between 3.4 and 14.8 percent over the past decade only because of a pandemic; in a normal year its whole national range is narrower than the distance between Munich and Seville in one ordinary June.
The Rankings Are Not Destiny, Which Is the Interesting Part
The natural reading of Table 1 is that Germany has a strong labor market and Spain a weak one, as a permanent fact of geography. The history says otherwise, and it says so twice in twenty years.
In August 2005, Germany’s unemployment rate was 11.2 percent and Spain’s was 8.6. Germany was the economy then routinely described as the sick man of Europe, absorbing reunification and carrying labor costs it could no longer devalue away. Spain, in the middle of a construction boom, had the better-looking labor market of the two.
Eight years later the picture had not just reversed but exploded. In March 2013, at the bottom of the European debt crisis, Spanish unemployment reached 26.3 percent against Germany’s 5.0, a gap of 21.3 points inside a single currency union. Today’s 6.2-point spread is what that gap looks like after thirteen years of slow convergence.
Two full reversals in one chart carry a lesson that no single month can: these gaps are made by institutions and shocks, not geography. Germany’s turnaround followed its labor market reforms of 2003 to 2005 and an export boom; Spain’s collapse followed a construction bust that took down the sector employing much of its workforce, and its long recovery has still not carried unemployment back to where it stood in 2007. What did not change at any point was the currency.
The Inflation Ranking Makes It Stranger
If high unemployment meant weak demand and weak demand meant low inflation, Spain should have the coolest prices in the table. It has the hottest. Spain pairs the highest unemployment, 10.1 percent, with the highest inflation, 3.57 percent. France pairs the lowest inflation, 2.02 percent, with the second-highest unemployment. Germany, tightest labor market of the four, sits in the middle of the inflation ranking.
Whatever version of the Phillips curve a reader carries around, this quarter it does not hold across the euro area. That is less damning than it sounds, and the distinction matters. The Phillips relationship, where it exists, describes one economy moving through time: unemployment falls below its normal level and inflation pressure builds. It was never a promise that countries could be ranked against each other, because each country’s normal level is set by its own institutions: how easily firms hire and fire, how wages are bargained, how generous and how long unemployment benefits run, how many workers sit on temporary contracts. Spain’s structural unemployment has been estimated in double digits for most of the modern era, so a 10.1 percent reading can coexist with a labor market that is, by Spanish standards, fairly tight, and with wage growth to match. The cross-section is not a Phillips curve, and June 2026 is a clean demonstration of why.
The energy shock that followed February 2026 also landed unevenly. The four national inflation rates entered the year between 0.4 and 2.4 percent and were pushed up together, but not equally, because energy weights, price regulation, and pass-through speed differ country by country. One shock, one currency, four different inflation outcomes: the same sentence the unemployment column has been saying for twenty years.
What a Single Interest Rate Can and Cannot Do
The ECB’s mandate is area-wide: 2 percent inflation for the euro area as a whole, currently 2.73 percent. It is not allowed, and not able, to weigh Seville against Munich. When the Governing Council sets 2.25 percent, that rate is transmitted through every mortgage, business loan, and government bond in the union, whatever the local labor market looks like.
A country with its own currency that found itself where Spain is would normally expect some help from depreciation, and one in Germany’s position would expect the opposite. Inside the euro that valve does not exist. Adjustment has to come the slow way: through wages and prices rising more slowly than the neighbors’, through workers moving, or through fiscal policy, and each channel is weaker in Europe than the textbook assumes. Wage cuts are resisted everywhere; labor mobility across euro countries is real but modest, held back by language and institutions in a way moving between American states is not; and the union’s central budget is small, with no permanent mechanism that taxes booming regions to support slumping ones the way a national treasury quietly does every year. The euro area’s architecture was built knowing all this, on the bet that the gaps would narrow over time. Figure 1 shows the bet half-won: the 2013 gap of 21.3 points is down to 6.2, but 6.2 is still a spread no single country would tolerate between its own regions without large transfers flowing.
The Bond Market Prices the Same Doubt
Unemployment is not the only place the union fails to average out. In June 2026 the French government paid 3.68 percent to borrow for ten years while Germany paid 2.97, a spread of 71 basis points between two founding members, in the same currency, with no exchange rate risk between them. That gap is the market’s price on French fiscal risk specifically, and it is the cleanest single number for the fact that the euro area is one currency but not one credit. A union that cannot equalize its labor markets also cannot equalize its borrowing costs, and the two failures feed each other: the countries that most need fiscal room to fight unemployment tend to be the ones paying more for it.
Why This Reaches Beyond Europe
For American readers, the euro area is the mirror image of a question the United States never has to ask. The fifty states also share one currency and one central bank, and their labor markets also differ, but a federal budget moves money between them automatically and workers cross state lines without changing language, license, or pension system. The euro area shows what the shared currency looks like without those shock absorbers. Every proposal for a new currency union anywhere in the world, and every argument about dollarization, is really an argument about whether the candidates resemble the American case or the European one.
There is also a direct channel. The euro is the world’s second currency, and the ECB’s rate path is set for the 6.3 percent average, not for either extreme. A central bank serving four labor markets this different moves cautiously, and that caution shapes the euro-dollar exchange rate, which prices American exports, European demand for them, and the dollar side of every portfolio that holds both. The American inflation comparison we published earlier this week put the Fed 1.4 points tighter than the ECB; part of the reason the ECB sits lower is that some of its members cannot carry more.
MASEconomics Explains
3 economic concepts behind the euro area’s unemployment gap
These concepts are explored in depth across our educational articles library.
Conclusion
The euro area unemployment rate of 6.3 percent is an average over economies that range from 3.9 to 10.1 percent, governed by one central bank that can only aim at the middle. The June 2026 grid adds the twist that makes the month worth recording: the inflation ranking inverts the unemployment ranking, with Spain highest on both counts and France lowest on inflation while second-highest on joblessness, so no simple demand story covers the table.
The history is the consolation and the warning at once. Germany stood above Spain in 2005; Spain stood 21.3 points above Germany in 2013; the spread is 6.2 points now. These positions are made by institutions, shocks, and reforms, and they can be unmade, but the adjustment happens over decades because the usual escape valve, the exchange rate, is welded shut. One currency, four labor markets, and a central bank that must pretend they are one: that arrangement, not any single number in it, is the story.
Frequently Asked Questions
Why is unemployment so much higher in Spain than in Germany?
Part of the gap is structural: Spain’s labor market has long run a high share of temporary contracts and a high normal level of unemployment, while Germany’s reforms of 2003 to 2005 lowered its own. Part is the aftermath of the construction bust of 2008 to 2013, from which Spanish unemployment has never fully returned to its 2007 low near 8 percent. The gap is not permanent, though: in August 2005 Germany’s rate was above Spain’s.
Why can’t the ECB set different interest rates for different countries?
Because there is one currency, money moves freely across the whole area, and a euro deposited in Madrid is identical to one deposited in Frankfurt. Any attempt to hold different policy rates in different members would be arbitraged away instantly. The ECB therefore targets area-wide inflation of 2 percent and sets one rate, currently 2.25 percent on the deposit facility, for all members.
Does June 2026 disprove the Phillips curve?
No, but it shows what the Phillips curve is not. The relationship describes one economy over time, relative to its own normal unemployment level. Comparing levels across countries mixes in every institutional difference between them, which is why Spain can hold the highest unemployment and the highest inflation at once. The cross-section failing tells you the countries have different structures, not that the within-country trade-off never exists.
What does the France-Germany bond spread have to do with unemployment?
Both measure the same underlying fact: the euro area shares a currency but not an economy. France paid 71 basis points more than Germany to borrow for ten years in June 2026, a gap that prices fiscal risk since currency risk between them is zero. Countries with weaker labor markets tend to need more fiscal support exactly when markets charge them more to finance it.
Could the unemployment gap close?
It has been closing since 2013, when it peaked at 21.3 points; it is 6.2 now. The record shows large moves are possible, in both directions, through reforms, sectoral booms and busts, and time. What the euro removes is the fast adjustment channel of a depreciating national currency, so convergence happens over decades rather than years.
Thanks for reading! The next time a euro area statistic appears in a headline, it is worth asking which of the twenty-one very different economies underneath it the number actually describes. Happy learning with MASEconomics