In 1789 the English philosopher Jeremy Bentham proposed that pleasure and pain could be scored like temperature, added up across people, and used to judge every law and every purchase. He needed a unit for the score, and later writers gave it a name: the util. Two hundred years on, no economist has ever measured one. What is utility, then, if nobody has ever seen a util? It is the name economics gives to the satisfaction a person gets from a good, a service, or an outcome. And the discipline’s answer to the measurement problem is the most interesting part of the story: economists stopped trying to measure satisfaction and learned to work with something weaker that turns out to be enough, the order in which a person ranks the options in front of them.
That quiet substitution matters outside the classroom. The logic of utility sits behind why an insurance premium and a lottery ticket can both be a defensible purchase, why the third coffee of the morning is worth less than the first, why water is nearly free while diamonds are not, and why an airline can charge two passengers on the same row prices that differ by a factor of four. Each of those follows from how choice behaves, not from any reading on a satisfaction meter.
A Ranking Device, Not a Thermometer
Utility is a way of representing preferences with numbers. If a person would choose an apple over a banana, an economist writes the apple with the higher utility number. The numbers themselves carry no meaning beyond the ordering: assigning the apple 10 and the banana 5 says exactly the same thing as assigning them 200 and 3. Nothing in the theory claims the apple delivers twice the pleasure, or 197 units more. The number is a bookkeeping entry for the ranking, and any relabeling that preserves the ranking tells the same story.
This is what separates the modern concept from Bentham’s original. His version, which economists call cardinal utility, treated satisfaction as a measurable quantity with meaningful gaps between levels. The version that survived, ordinal utility, keeps only the order. The shift was completed in the 1930s, when economists showed that everything demand theory needed, how consumers respond to prices, how they split a budget, how markets add up individual choices, could be derived from rankings alone. The apparatus of indifference curves is exactly this idea drawn on paper: curves that connect all the bundles a consumer ranks equally, with no unit of satisfaction anywhere on the map.
One discipline follows immediately. Because the numbers are only labels, utility cannot be compared across people. A theory built on rankings can say that a person prefers bread to opera tickets at current prices. It cannot say that bread gives a poor family more utility than the opera gives a rich one, however plausible that sounds, because no common scale exists on which the two families’ satisfaction could be placed. Economists who make distributional arguments have to bring that scale in from outside the theory, as an ethical judgment, and the honest ones say so.
The Second Slice Is Worth Less
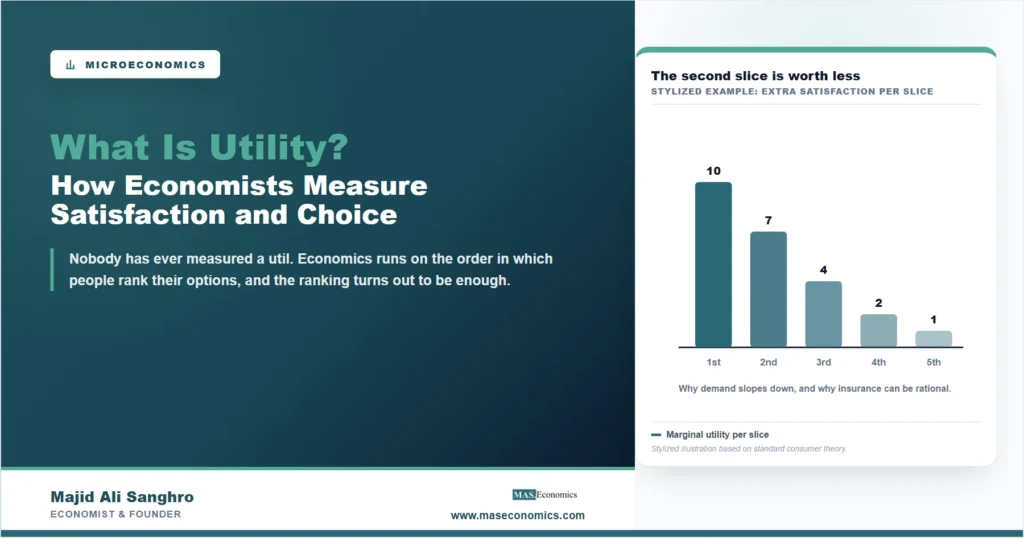
The working engine of utility theory is a regularity so familiar it barely registers: the first unit of almost anything matters more than the fifth. The first slice of pizza after a long day does real work. The second is welcome. By the fourth, eating has become a decision rather than a desire. Economists call the extra satisfaction from one more unit marginal utility, and its tendency to shrink as consumption rises the law of diminishing marginal utility.
Diminishing marginal utility resolves a puzzle that troubled economists for a century. Water is essential to life and costs almost nothing; diamonds are ornamental and cost a fortune. The resolution is that price tracks the margin, not the total. Water’s total contribution to wellbeing is enormous, but in most places the next liter is worth very little because so many liters are already available. The next diamond is scarce. Prices in a market are set where the marginal buyer stands, which is why total importance and market price can point in opposite directions. The same logic drives everyday budgeting: a person keeps shifting spending toward whatever currently delivers the most satisfaction per dollar at the margin, and stops shifting when the last dollar in every direction earns roughly the same return. That stopping rule, not any measurement of pleasure, is what a demand curve summarizes, and it is why demand curves slope downward and respond to prices in the patterns that elasticity measures.
How Economists Read Satisfaction Off Behavior
If satisfaction cannot be observed, something observable has to stand in for it, and the modern answer is behavior itself. In 1938 Paul Samuelson turned the logic around: instead of assuming a utility scale and deriving choices, start from the choices and infer the ranking. If a consumer bought bundle A when bundle B was affordable, the consumer has revealed a preference for A over B, and a consistent set of such choices traces out the same demand behavior the older theory assumed. The approach, developed fully in revealed preference theory, is why a supermarket loyalty card or a streaming service’s watch history works as an economic measuring instrument. The firm never asks how much anything is enjoyed. It watches what gets chosen when prices and options change, which is the only satisfaction data that exists.
Consistency is doing real work in that argument. The rankings have to hang together: a person who prefers A to B and B to C should not also prefer C to A. The money pump argument shows why this is more than mathematical tidiness. Anyone holding circular preferences can be charged a small fee to trade C for B, another to trade B for A, another to trade A for C, and be led around the circle until their wallet is empty, ending exactly where they began minus the fees. Coherent rankings are what protect a chooser from becoming someone else’s income stream.
Choice under risk needed one more piece. A consumer choosing between certain bundles only needs an ordering, but a person choosing between a certain salary and a risky business venture is choosing between probability distributions. In 1944 John von Neumann and Oskar Morgenstern showed that if such choices obey a short list of consistency conditions, they behave as if the person assigned utilities to outcomes and picked the option with the highest expected utility, probability-weighted average utility rather than probability-weighted average money. That single idea carries most of the economics of risk.
Why Insurance and a Lottery Ticket Can Share a Wallet
Expected utility explains a purchase that puzzles people when they first look at it closely: insurance is, on average, a losing bet. Premiums across all customers must exceed payouts, or the insurer could not pay claims, salaries, and shareholders. Yet buying it is rational for a simple reason rooted in diminishing marginal utility. Money, like pizza, is worth less at the margin the more of it one has, so the dollars a household would lose in a fire, the dollars that pay rent and buy groceries, carry far more utility than the dollars it pays in premiums. Giving up low-value dollars for certain to protect high-value dollars against disaster raises expected utility even though it lowers expected wealth. The same shape of reasoning, run in reverse, says a person whose utility for money diminishes should never buy a lottery ticket, and millions of insurance-holding households buy them anyway. Milton Friedman and Leonard Savage pointed at that combination in 1948, and the honest position is that expected utility explains the insurance side cleanly, while the lottery side needs something extra, a taste for the gamble itself, or the hope of jumping to a different standard of living, that the basic theory does not supply.
The other side of these numbers is an industry. Insurers, pension funds, and casinos are all, in effect, firms whose product is a reshaped utility curve: they buy risk from people who dislike it and sell chance to people who enjoy it, and the margin between what risk-averse and risk-loving customers will pay is their revenue. When a bank prices a loan, or an employer weighs a fixed salary against commission, the pricing runs on the same concavity of the utility of money, which is also why the behavioral economics findings discussed below matter commercially and not just academically.
Where the Ranking Machine Breaks
The theory’s weak points are well mapped, and several were found by testing it the way one would test any machine. Decades of experiments show that actual choices violate the consistency conditions in systematic ways. People value a good more once they own it than they did before owning it. They treat a loss of $100 as far heavier than a gain of $100, which fixed expected utility cannot reproduce. They reverse rankings depending on how identical options are worded. They keep paying into failed projects because of what is already spent, the pattern the sunk cost fallacy names, even though a coherent ranking of futures would ignore money that is gone under every description.
A second complication is that satisfaction sometimes depends on other people’s consumption rather than one’s own. The theory assumes a good delivers utility through use, but Veblen goods are bought partly because they are expensive and visibly so; the price is part of the product. Rankings that shift with the audience are harder to pin down with the standard tools, though economists have built extensions that handle them.
The deepest issue is a distinction psychology forced back into economics. Daniel Kahneman, whose experimental work earned the 2002 Nobel Prize in economics, separated decision utility, what choices reveal, from experienced utility, what living through the outcome actually feels like, and showed the two regularly disagree: people mispredict what they will enjoy, and memory scores an experience by its peak and its ending rather than its duration. Revealed preference is silent about this gap, because it defined the problem away by treating choice as the only evidence. None of these findings has retired the framework. They mark its boundary: utility theory is a strong account of reasonably consistent choice under scarcity, not a science of happiness, and the difference between those two things is exactly what Bentham’s thermometer was supposed to abolish.
MASEconomics Explains
3 economic concepts behind utility
These concepts are explored in depth across our educational articles library.
Explore the MASEconomics BlogConclusion
What is utility comes down to a change of question. Bentham asked how much pleasure a thing delivers and needed a unit nobody could supply. Economics eventually asked which option a person ranks first and found that the ranking alone, if it is internally consistent, supports the whole structure of demand: diminishing marginal utility, the budget-allocation rule, the resolution of the water-diamond paradox, and, once probabilities enter, the economics of insurance and risk. The util was never measured because it never needed to be. Choice was the evidence all along.
The boundary of the idea is as well established as the idea itself. Utility numbers cannot be compared across people, experiments show systematic departures from consistency, and choices made in advance are an imperfect guide to what outcomes feel like when they arrive. Within that boundary, utility remains the working language of microeconomics: a compact way of saying that people facing scarcity rank their options and act on the ranking, and that the rankings, added up across a market, become the prices everyone else has to reckon with.
Frequently Asked Questions
What is utility in simple terms?
Utility is the satisfaction or benefit a person gets from a good, a service, or an outcome. In modern economics it works as a ranking: a higher utility number means an option is preferred, and the numbers carry no meaning beyond that order. Economists infer utility from the choices people actually make rather than measuring satisfaction directly.
What is the difference between total utility and marginal utility?
Total utility is the satisfaction from everything consumed; marginal utility is the extra satisfaction from one more unit. As consumption of a good rises, total utility typically keeps rising but marginal utility shrinks. Prices and everyday spending decisions track the margin, which is why essential goods like water can be cheap while total utility from them is enormous.
What is the law of diminishing marginal utility?
It is the regularity that each extra unit of a good adds less satisfaction than the one before, the second slice of pizza matters less than the first. It explains why demand curves slope downward, why consumers spread a budget across many goods instead of spending everything on one, and why the utility of money itself flattens as wealth rises.
Can utility actually be measured?
No instrument measures satisfaction directly, and modern theory does not require one. Economists use ordinal utility, which records only the order of preferences, and read that order off observed choices through revealed preference. Survey-based wellbeing research and experimental measures of experienced utility exist, but they sit alongside the choice-based framework rather than inside it.
What is the difference between cardinal and ordinal utility?
Cardinal utility treats satisfaction as a quantity with meaningful differences, so 20 utils would be twice 10. Ordinal utility keeps only the ranking of options, so the numbers are interchangeable labels. Economics moved to the ordinal version in the 1930s after showing that demand theory needs nothing stronger, though expected utility theory restores a limited cardinal structure for choices involving risk.
Thanks for reading! The next time an insurance renewal and a lottery kiosk show up in the same afternoon, the curve behind both prices will be visible. Happy learning with MASEconomics