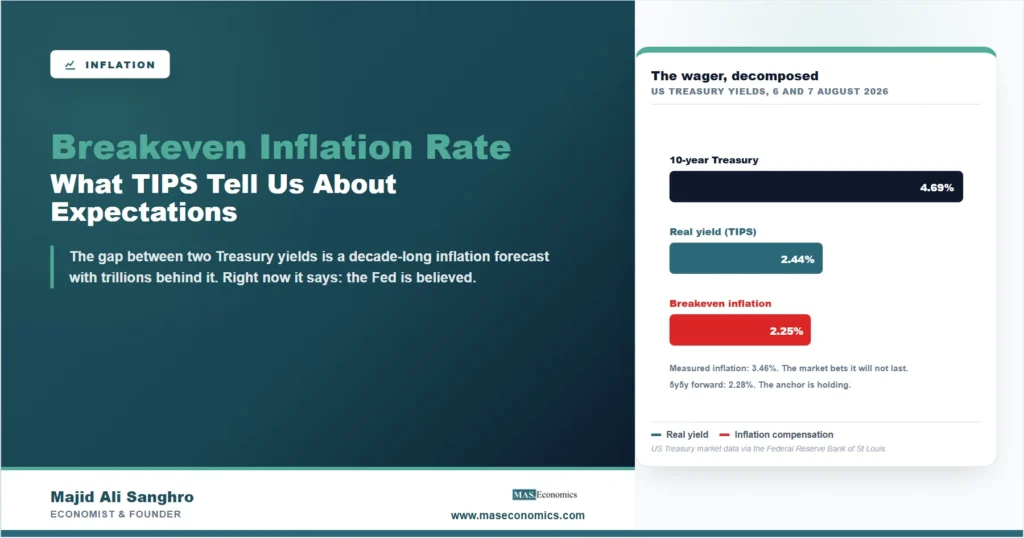
Buried in the gap between two Treasury yields sits the most honest inflation forecast in the world, honest not because the forecasters are wise but because they are paid for being right. The breakeven inflation rate is the difference between the yield on an ordinary government bond and the yield on an inflation-protected one of the same maturity, and it measures the average inflation at which the two investments would pay off identically. In early August 2026, the 10-year Treasury yielded 4.69 percent while its inflation-protected counterpart offered about 2.44 percent in real terms, putting the 10-year breakeven at 2.25 percent. That number is the bond market’s wager, backed by trillions of dollars, on what American inflation will average for a decade.
What makes the current reading remarkable is the company it keeps. Measured US inflation is running at 3.46 percent, the highest in the rich world, yet investors pricing the next ten years settle on 2.25. The market is saying, with its own money, that it believes the present inflation is temporary and the Federal Reserve’s 2 percent target is roughly credible. Whether that belief is wisdom or complacency, no survey can match the sincerity of the source.
The Arithmetic of the Wager
The mechanism needs two instruments. An ordinary Treasury bond promises fixed dollar payments, so inflation eats its return one-for-one; buyers therefore demand a yield that covers expected inflation plus a real return. Treasury Inflation-Protected Securities, TIPS, promise payments that adjust with the consumer price index, so their quoted yield is already a real return, inflation-proof by construction. Hold the borrower, maturity, and market constant, and the only meaningful difference between the two yields is the inflation compensation buyers require:
The name states the bet exactly. If inflation over the next decade averages more than 2.25 percent, the TIPS buyer wins, protection cost less than the inflation it covered; average less, and the ordinary bond wins. Every investor choosing between the two instruments is forced to act on an inflation view, and the breakeven is where those views clear. The plumbing that makes bond prices and yields move against each other, the foundation for reading any of this, is set out in our primer on how bonds work.
What the Market Is Saying Right Now
Read as a message, the August 2026 configuration is striking. Headline inflation of 3.46 percent, examined in our piece on why US inflation leads the rich world, sits more than a point above a 10-year breakeven of 2.25. The market is pricing the current episode as a hump to be crossed, not a new normal: near-term inflation elevated, the long average pulled back toward target. Central bankers call this anchored expectations, and it is the single condition that separates a manageable inflation from a 1970s repeat, the theme our article on inflation expectations develops in full.
Policymakers refine the reading with a sharper instrument. The five-year, five-year forward rate strips out the noisy near term and asks what the market expects inflation to average in the five years beginning five years from now, a window far enough out that today’s oil prices and tariff rounds should not matter. In early August 2026 it stood at 2.28 percent, within touching distance of the target once the index difference is allowed for. That is the number the Federal Reserve actually watches when it asks whether credibility is holding while it fights the current episode, and its stability this year is quietly one of the most consequential facts in American monetary policy, given how much else, as our analysis of the stubborn long end shows, is pushing Treasury yields around.
Where the Forecast Bends
The breakeven is the best market-based inflation gauge available, and it is not a pure one, for reasons worth holding onto. Ordinary Treasuries are the most liquid securities on earth; TIPS trade in a thinner market, and in panics the liquidity gap widens sharply, which is why breakevens collapsed during 2008 and March 2020 in ways that reflected trading conditions, not deflation forecasts. A risk premium also lives inside the number: buyers of ordinary bonds may demand extra compensation for bearing inflation uncertainty, which pushes breakevens slightly above pure expectations in nervous times. And the instrument compensates using the consumer price index, while the Federal Reserve targets a different measure that historically runs a few tenths lower, so a breakeven modestly above 2 percent is consistent with the target being exactly met.
None of these caveats retires the tool; they calibrate it. Sudden breakeven moves during market stress should be read as plumbing first and prophecy second. Slow drifts, especially in the five-year, five-year forward, are the signal worth taking seriously, because they show the compensated consensus about the world after the current episode ends. The same discipline applies here as everywhere on the yield curve: prices embed forecasts, premia, and frictions at once, and the craft is in the separation.
MASEconomics Explains
3 economic concepts behind breakeven rates
These concepts are explored in depth across our educational articles library.
Explore the MASEconomics BlogConclusion
The breakeven inflation rate turns the gap between two Treasury yields into a forecast with money behind it: at 2.25 percent for ten years in early August 2026, against measured inflation of 3.46, the market is pricing the current episode as temporary and the Federal Reserve’s target as broadly credible, with the five-year, five-year forward at 2.28 making the same statement more cleanly. No committee published that forecast; it cleared, position by position, between investors who profit only if they are right.
Its imperfections are the ordinary ones of market prices, liquidity gaps that distort it in panics, a risk premium that pads it in nervous times, an index mismatch worth a few tenths, and the remedy is calibration rather than dismissal. Read slowly, at the far end of the curve, breakevens are the closest thing economics has to a continuous referendum on central bank credibility, and at this writing the referendum is passing.
Frequently Asked Questions
What is the breakeven inflation rate in simple terms?
It is the difference between the yield on an ordinary government bond and an inflation-protected bond of the same maturity. That gap equals the average inflation rate at which both investments would return the same, so it reads as the bond market’s expected inflation over that horizon, plus small premia.
How is the breakeven rate calculated?
By subtraction: the nominal Treasury yield minus the TIPS yield at the same maturity. In early August 2026 the 10-year Treasury yielded 4.69 percent and the 10-year TIPS about 2.44 percent in real terms, giving a breakeven of roughly 2.25 percent per year over the decade.
What are TIPS?
Treasury Inflation-Protected Securities are US government bonds whose principal rises with the consumer price index, with interest paid on the adjusted principal. Their return is protected from inflation by construction, which is why their yield is a real yield and why comparing them with ordinary Treasuries reveals the market’s inflation compensation.
Is the breakeven rate a reliable inflation forecast?
It is the best continuous market-based gauge, with known distortions: TIPS are less liquid than ordinary Treasuries, so panics move breakevens for trading reasons, and a small risk premium pads the number in uncertain times. Slow movements, especially in longer horizons, are meaningful; sharp moves during market stress usually reflect plumbing.
What is the five-year, five-year forward inflation rate?
It is the market’s expected average inflation for years six through ten, computed from breakevens of different maturities. Because it excludes the near-term noise of current shocks, central banks watch it as the cleanest test of whether long-run expectations remain anchored to the inflation target. In early August 2026 it stood at 2.28 percent.
Thanks for reading! A forecast nobody wrote, cleared between investors paid for being right: the gap between two Treasury yields says more than most speeches. Happy learning with MASEconomics