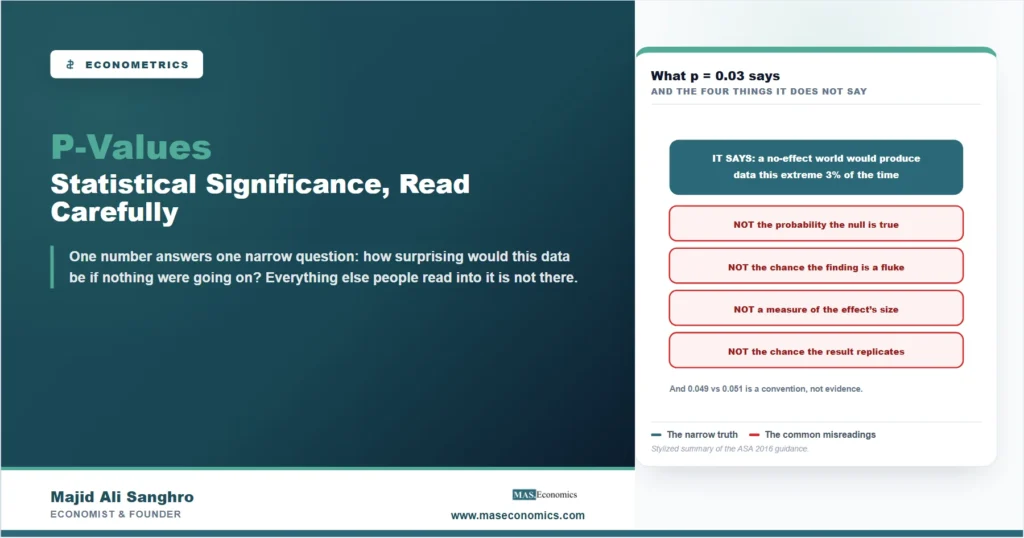
In 2016 the American Statistical Association took the unusual step of issuing a formal statement to correct how an entire scientific culture was using one number, and the number was not obscure: it appears in nearly every empirical paper published in economics. P-values answer a narrow and precise question: if there were truly no effect, how surprising would data at least this extreme be? A p-value of 0.03 says that a world with no effect would produce a result this large or larger only 3 percent of the time. That is all it says. It is not the probability the finding is false, not the probability the null hypothesis is true, not a measure of the effect’s size or importance, and not a certificate that the result will replicate. The gap between the narrow question the number answers and the sweeping conclusions it is used to license has produced enough damage that the statisticians’ professional body felt obliged to intervene, and reading the number correctly is now a basic form of self-defense for anyone who consumes empirical claims.
The Question the Number Actually Answers
The machinery is conditional reasoning, and the condition is everything. A researcher testing whether some coefficient differs from zero begins by assuming, for argument’s sake, that it does not: the null hypothesis. Under that assumption, and given the model, the test statistic has a known sampling distribution, the range of results that pure chance would generate across hypothetical repeated samples; the framework is developed in our guide to hypothesis testing. The p-value locates the actual result in that landscape: the share of the no-effect world’s results that are at least as extreme as the one observed. A small value says the data sit far out in the tails of the boring world, which is evidence against it; a large value says the data are unremarkable if nothing is going on.
Every word of that construction matters, because the popular reading quietly reverses the conditioning. The p-value is the probability of the data given the null, not the probability of the null given the data, and the two can differ enormously: a surprising result under the null may still be more plausibly chance than effect if real effects of that kind are rare. Converting evidence about data into probabilities about hypotheses requires prior information the p-value does not contain, which is the road into Bayesian econometrics, and the refusal to distinguish the two conditionals is the single most common statistical error in circulation. The ASA’s 2016 statement put it plainly: p-values do not measure the probability that a hypothesis is true, and scientific conclusions should not be based only on whether a p-value passes a threshold.
The Tyranny of 0.05
The 5 percent significance threshold began as a convenience. Ronald Fisher, tabulating distributions in the 1920s, suggested one in twenty as a reasonable line for judging whether a result deserved attention, and a century of textbooks hardened the suggestion into an apparent law of nature. The line has no optimality property: nothing in statistics distinguishes 0.049 from 0.051 except which side of an arbitrary convention they fall on, yet careers, publications, and policy claims have turned on that distinction. The binary habit damages inference twice over. It converts a continuous measure of surprise into a pass-fail stamp, discarding the information in the number itself; and it creates a cliff worth manipulating, which is where the deeper trouble begins.
That trouble has a name: p-hacking. A researcher with flexible choices, which variables to control for, which observations to exclude, which of several outcomes to report, can run many defensible variants and publish the one that clears the line, and the reported p-value is then meaningless, because it describes one test selected from many rather than one test conducted once. None of this requires bad faith; the flexibility does the damage on its own, and the published literature’s suspicious pile-up of results just below 0.05 is its fingerprint. The countermeasures reshaping empirical practice, pre-registration of specifications, reporting all variants, replication, are attempts to remove the selection that poisons the number, and modern resampling approaches described in our article on bootstrap methods at least ensure the distribution behind a single test is honestly computed.
Significant, and Trivial; Insignificant, and Important
The final correction is the one economics has most needed: statistical significance is not economic significance. The p-value reflects the ratio of an estimate to its sampling noise, and noise shrinks with sample size, so in the enormous datasets now routine, utterly trivial effects clear any threshold; a wage effect of a hundredth of a percent will be starred at three asterisks given millions of observations, while remaining irrelevant to any decision a human would make. The reverse failure is just as costly: an imprecisely estimated but large effect, p-value 0.15, may represent exactly the relationship a policymaker needs to know about, and reading its insignificance as evidence of no effect confuses absence of evidence with evidence of absence. The remedy in both directions is the same: read the coefficient, in its units, from the regression itself, whether a simple linear regression or a multiple regression model, ask whether the magnitude would matter if true, and treat the uncertainty around it as a range to reason with rather than a hurdle to clear. The discipline of asking what question the statistic answers, before letting it answer a different one, is the core habit of econometrics done well.
MASEconomics Explains
3 economic concepts behind p-values
These concepts are explored in depth across our educational articles library.
Explore the MASEconomics BlogConclusion
P-values compress one legitimate piece of information into one endlessly misread number: how surprising the data would be in a world where nothing is going on. Used as designed, the measure is a useful screen against being impressed by noise. Used as it commonly is, as the probability a finding is true, as a pass-fail stamp at an arbitrary threshold, as a ranking of importance, it answers questions it was never built for, and the profession’s own statistical association eventually said so in writing.
The reading rules that survive scrutiny fit in a paragraph. Remember the conditioning: the number judges data assuming the null, never the null itself. Refuse the cliff: 0.049 and 0.051 are the same evidence, and a continuous measure deserves a continuous reading. Suspect selection: a value produced by flexible analysis describes the flexibility, not the world. And keep significance in its lane: whether an effect matters is a question about magnitudes, units, and decisions, on which the p-value is silent. The statistic is a doorman, useful for turning obvious noise away; the mistake of a scientific generation was letting the doorman decide what is true.
Frequently Asked Questions
What is a p-value in plain words?
It is the probability of getting a result at least as extreme as the one observed, calculated under the assumption that there is truly no effect. A p-value of 0.03 means a no-effect world would produce data this striking only 3 percent of the time. It measures how surprising the data are for the null hypothesis, nothing more.
Does p less than 0.05 mean there is a 95 percent chance the effect is real?
No. The p-value conditions on the null being true; it cannot report the probability that the null is false, which additionally depends on how plausible real effects were before the data arrived. A surprising result in a field of rare true effects can still, more often than not, be a fluke, which is exactly why replication matters.
Why is 0.05 the significance threshold?
Convention, traceable to Fisher’s suggestion in the 1920s that one in twenty was a sensible level for flagging results worth attention. No statistical principle privileges it, results at 0.049 and 0.051 carry essentially identical evidence, and the hard cliff the convention created is what makes selective reporting around it profitable.
Can a result be statistically significant but economically meaningless?
Easily, and in large datasets, routinely. The p-value shrinks with sample size, so trivial effects become highly significant given enough observations. Whether an effect matters is a question about its magnitude in real units, which the p-value does not measure; a starred coefficient can describe an effect too small for any decision to notice.
What is p-hacking?
Trying many defensible analysis variants, different controls, samples, or outcome measures, and reporting the one that crosses the significance threshold. The published p-value then dramatically overstates the evidence, because it ignores the search that produced it. Pre-registration, full reporting of specifications, and replication are the standard defenses.
Thanks for reading! The p-value is a doorman, good at turning noise away; the mistake was letting it decide what is true. Happy learning with MASEconomics