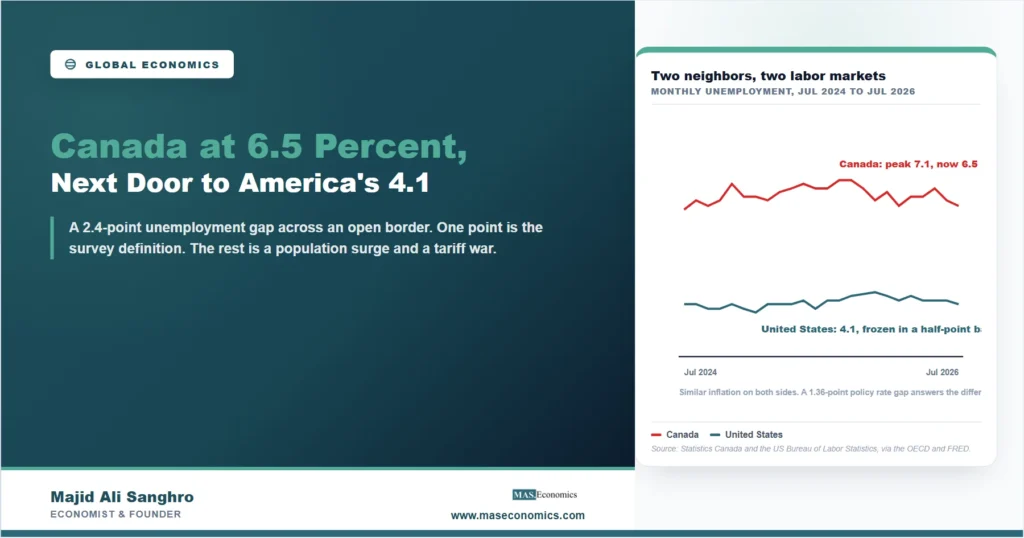
The world’s longest undefended border separates two labor markets that refuse to match. Canada unemployment stood at 6.5 percent in June 2026 while the United States, one integrated supply chain away, recorded 4.1 percent in July. A 2.4-point gap between two economies this entangled, with similar inflation on both sides, 2.80 percent in Canada against 3.46 in the United States, is the kind of number that should not survive casual explanation. Workers cross this border, firms operate on both sides of it, and yet one market carries half again the joblessness of the other.
The gap is not new, but its size is. Across 2022 the two rates averaged 5.2 and 3.6 percent, a difference of about a point and a half. By 2025 the averages were 6.9 and 4.3, a gap of two and a half points, and Canada’s rate touched 7.1 percent that autumn before easing. Something widened the distance between two economies that usually move together, and taking the question apart yields one measurement lesson and two genuinely economic ones.
The Gap on the Chart
Two shapes stand out. Canada’s line climbs through 2025 to a 7.1 percent peak and then bends down, reaching 6.5 by June 2026, back to where it stood before the worst of the climb. The American line barely moves, drifting inside a half-point band and ending at 4.1. One market went through a slump and is recovering; the other froze in place. That difference in shape, not just level, is the first clue about what is actually happening.
A Point of Measurement, Then Two Points of Economics
Start with the measurement, because it is real and routinely ignored. The two countries count the unemployed differently: Canada’s survey includes groups the American definition excludes, such as people who searched only passively or who have a job starting soon. Statistics Canada itself publishes a US-comparable rate, and the adjustment has historically been worth roughly a point. So a fair comparison shrinks the 2.4-point gap toward a point and a half. That is the lesson for reading any cross-border statistic, but it also sharpens the puzzle: a point and a half of genuine difference between integrated neighbors still needs explaining, and it did not exist a few years ago.
The first economic explanation is arithmetic done by population. Canada ran one of the fastest population expansions in the rich world through 2023 and 2024, driven by immigration, and its labor force grew faster than its economy could absorb. Unemployment can rise without a single layoff when the queue of job seekers lengthens faster than the row of jobs; much of Canada’s climb through 2024 and 2025 was exactly that. The United States ran the opposite experiment: as our analysis of the frozen American labor market showed, job creation nearly stopped, but so did firing, and a market where nobody hires and nobody fires can hold a low unemployment rate while feeling stagnant to anyone inside it. Canada’s higher number partly reflects churn and growth in the workforce; America’s lower one partly reflects a door that stopped revolving.
The second explanation is trade exposure. Canada sells about three quarters of its exports to the United States, so the tariff conflict of 2025 and 2026 landed on Canadian manufacturing with a force no other rich economy experienced. An integrated supply chain is a blessing that invoices both ways: when the larger partner raises the cost of crossing the border, the smaller partner’s factories feel it first. The timing of Canada’s 2025 unemployment peak sits uncomfortably well beside that conflict’s escalation.
Two Central Banks Read Their Own Charts
The policy response followed the slack, and it shows up in the price of money. Canada’s short-term rate sits at 2.27 percent against an American federal funds rate of 3.63, a 1.36-point difference between two economies whose inflation rates are 0.66 points apart. The Bank of Canada eased aggressively into its weakening labor market, and Canada’s bending curve since late 2025 is consistent with that medicine working. The Federal Reserve, facing the rich world’s highest inflation and a labor market that looks tight on paper, has held tighter, with consequences for long rates that our piece on the mortgage market traces. Two neighbors, two diagnoses, two rate paths: the unemployment gap is being answered, just not identically.
What the gap is not, on current evidence, is a simple verdict that one economy is failing. Canada’s rate is elevated partly because its workforce grew explosively, which is a problem of absorption, not collapse; the relationship between growth and unemployment that Okun’s law describes gets noisy when the labor force itself is the moving part. And America’s 4.1 percent sits atop hiring conditions that feel nothing like the number’s history. The honest reading is narrower and more useful: measurement explains part of the gap, labor force growth and tariff exposure explain most of the rest, and the two central banks’ diverging rates are the market price of that difference.
MASEconomics Explains
3 economic concepts behind the Canada-US gap
These concepts are explored in depth across our educational articles library.
Explore the MASEconomics BlogConclusion
Canada unemployment at 6.5 percent beside an American 4.1 is a 2.4-point gap that decomposes rather than mystifies. Roughly a point is definitional, the price of comparing two different surveys. The remainder is real and recent: a labor force that grew faster than the economy could seat it, and a tariff conflict that hit the most America-exposed manufacturing sector in the rich world. The two lines’ shapes carry the second half of the story, Canada’s slump bending toward recovery as aggressive easing works through, America’s frozen market holding a low rate that describes less than it used to.
The gap has already narrowed from its 2025 extreme, and the 1.36-point difference in policy rates is the mechanism doing the closing. What remains is the standing lesson: an unemployment rate is a survey definition wrapped around an economy, and two of them, even across an open border, only become comparable after the definitions, the denominators, and the shocks have each been given their share.
Frequently Asked Questions
Why is unemployment higher in Canada than in the United States?
Three reasons stack up. Canada’s survey definition counts more people as unemployed, historically worth about a point. Its labor force grew unusually fast through immigration in 2023 and 2024, outpacing job creation. And its export sector, which sends about three quarters of its goods to the United States, absorbed the heaviest tariff exposure of any rich economy in 2025 and 2026.
Do Canada and the US measure unemployment the same way?
No. Both use household surveys, but Canada includes passive job seekers and people with a job starting soon, whom the American definition excludes. Statistics Canada publishes a US-comparable rate that has typically run roughly one point below its headline figure, and serious cross-border comparisons use it.
Does higher unemployment mean Canada’s economy is weaker than America’s?
Not by itself. Part of Canada’s higher rate reflects a rapidly growing labor force waiting to be absorbed, which is a growth problem rather than a collapse. Meanwhile the low American rate sits on a market where hiring has nearly stopped, so the two headline numbers overstate the difference in how the two economies actually feel to workers.
Why are Canadian interest rates lower than American rates?
Because the two central banks face different conditions: Canada has more labor market slack and lower inflation, so the Bank of Canada eased further, to 2.27 percent on short rates against an American 3.63. Rate differences of this kind move the exchange rate and are a normal feature of independent monetary policy between integrated economies.
Is Canada’s unemployment rate improving?
The direction through the first half of 2026 was down: from a peak of 7.1 percent in late 2025 to 6.5 by June 2026, back to its level of September 2024. The improvement coincides with substantially lower interest rates working through the economy, though the level remains well above the pre-2024 norm.
Thanks for reading! Two neighbors, one border, and a reminder that an unemployment rate is a definition before it is a diagnosis. Happy learning with MASEconomics