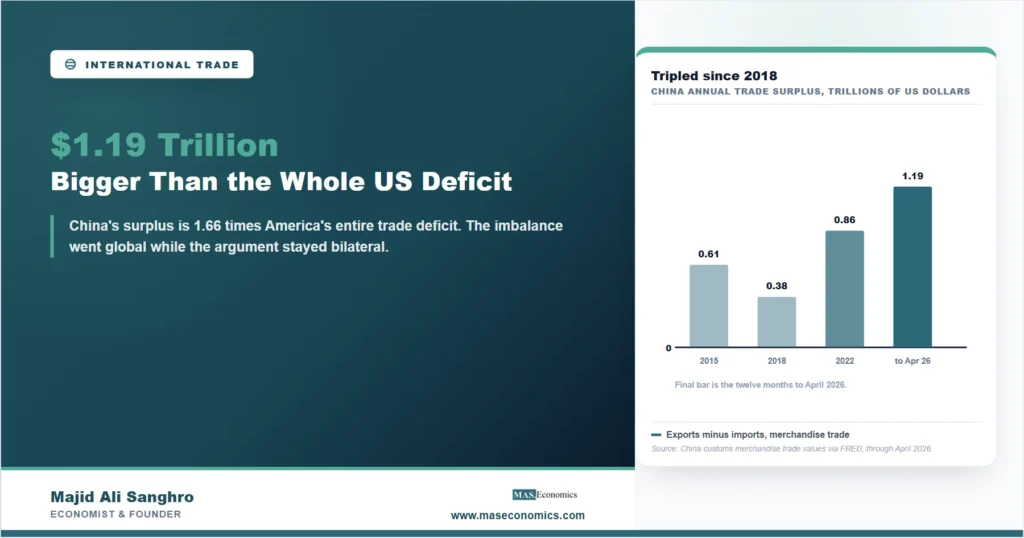
Over the twelve months to April 2026, China sold the rest of the world $1.19 trillion more than it bought from it. The same twelve months left the United States with a goods and services deficit of $717 billion. Those two figures do not fit together in the way most commentary assumes: the China trade surplus is 1.66 times the size of the entire American deficit, so even if every dollar America overspent abroad had gone to China, and none of it went anywhere else, $475 billion of China’s surplus would still be unaccounted for.
That arithmetic is the reason this number deserves a careful reading rather than another round of the same argument. The imbalance between China and the world has outgrown the imbalance between China and America, which means the adjustment pressure, whenever it comes, will not fall where the tariff debate has been pointing. Chinese customs data reaches us with a lag of about four months, so April 2026 is the most recent month available, and the twelve-month total is the figure to use because single months in this series swing violently with the timing of the Lunar New Year.
Three Times What It Was in 2019
The shape of that chart is the first surprise. The surplus was shrinking, not growing, through the second half of the 2010s: from $606 billion in 2015 down to $375 billion in 2018, its lowest point in the series. It has risen in every full year since, and the total for the twelve months to April 2026 is more than three times the 2018 figure. Whatever caused the reversal began around 2019 and has not stopped.
The second surprise is what did not cause it. A common reading holds that China’s surplus grew because China stopped buying from abroad. The series does not support that. Compared with the twelve months to April 2019, Chinese exports are up 59.5 percent and Chinese imports are up 30.8 percent. Imports grew substantially; exports simply grew about twice as fast. Export growth alone added $1,482 billion to the trade flows, and rising imports absorbed $655 billion of it, leaving the $828 billion increase in the surplus.
| Twelve months to April | Exports | Imports | Surplus | Exports per dollar of imports |
|---|---|---|---|---|
| 2016 | $2.19tn | $1.60tn | $0.58tn | $1.36 |
| 2019 | $2.49tn | $2.13tn | $0.36tn | $1.17 |
| 2021 | $2.90tn | $2.28tn | $0.62tn | $1.27 |
| 2025 | $3.65tn | $2.55tn | $1.10tn | $1.43 |
| 2026 | $3.98tn | $2.78tn | $1.19tn | $1.43 |

|
||||
The last column is the compact version of the story. In the year to April 2019, China exported $1.17 for every dollar it imported. It now exports $1.43. Had imports kept pace with exports since 2019, the surplus today would be $582 billion instead of $1.19 trillion, so roughly half the current figure comes from the gap between the two growth rates rather than from export strength on its own. Note also that the ratio was already $1.36 in 2016, fell through 2019 and then climbed again, so this is a cycle with a direction, not a straight line.
Someone Is on the Other Side of $1.19 Trillion
Every surplus is somebody’s deficit, and this is where the number becomes a statement about the reader’s own economy rather than about China. A country running a $1.19 trillion trade surplus is, by the accounting identity, lending that amount to the rest of the world, whether through official reserves, corporate holdings, or private portfolios. The counterpart to the goods leaving Chinese ports is a claim on foreign assets arriving in Chinese hands, and the mechanics of how that balances are set out in our piece on the differences between the balance of payments and the balance of trade.
The distribution of that counterpart is what the American figure settles. The United States ran a $717 billion goods and services deficit over the same twelve months, a gap whose mechanics we set out separately in what a trade deficit actually means, and it falls $475 billion short of China’s surplus. The bilateral American deficit with China is only a portion of the American total, so the share of China’s surplus absorbed by the United States is smaller still. The rest is absorbed by everyone else: Europe, the ASEAN economies, Latin America, Africa, and the Gulf. That is why an American tariff response, whatever its merits, addresses a minority of the imbalance, a point the size and persistence of the numbers make before any theory is introduced. Our account of the tariff war of 2025 and 2026 covers what those measures did do, and our examination of whether deglobalization is real shows how little the aggregate flows bent.
For an ordinary reader in a deficit country the consequence is not abstract. Persistent trade deficits are financed by selling assets or issuing debt to foreigners, which is why the imbalance shows up eventually in who owns the housing stock, the corporate bonds and the government paper, and why balance of payments disequilibrium is a question about ownership rather than only about factories. It also puts a floor under the domestic prices of anything competing with Chinese production, and a ceiling on the prices of everything imported from it.
What the Number Does Not Settle
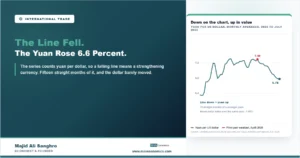
Three limits belong on the record. The surplus is measured in current dollars, so part of its growth reflects prices rather than volumes, and a dollar of 2026 trade is not a dollar of 2015 trade. The series is merchandise trade only, which flatters China relative to economies with large services exports and understates the American position, since American services run a surplus that partly offsets the goods deficit. And the surplus reflects the exchange rate at which those flows are converted, which has moved materially: the yuan appreciated about 6.6 percent against the dollar in the year to July 2026, and the effect of currency moves on trade balances is neither immediate nor in the direction intuition suggests, as our explainer on the J-curve effect sets out.
None of those limits changes the ordering of magnitudes, which is what the article rests on. A surplus of $1.19 trillion is $3.3 billion a day, and it is roughly 3.7 percent of the entire annual output of the United States. It has tripled in seven years while the world’s attention has been on the bilateral relationship that accounts for a minority of it.
MASEconomics Explains
3 economic concepts behind the surplus
These concepts are explored in depth across our educational articles library.
Explore the MASEconomics BlogConclusion
The China trade surplus of $1.19 trillion over the twelve months to April 2026 is three times what it was in 2018, and it grew because exports rose 59.5 percent since 2019 while imports rose 30.8 percent, not because China stopped buying. China now exports $1.43 for every dollar it imports, against $1.17 seven years ago, and half of the increase in the surplus is attributable to that widening ratio rather than to export volume alone.
The figure that reframes the discussion is the comparison with the United States. America’s entire goods and services deficit over the same period was $717 billion, so China’s surplus exceeds it by $475 billion, and the bilateral portion is smaller than the American total. The imbalance has become a global one while the argument about it has stayed bilateral, and the countries absorbing the remainder are financing it the same way any deficit is financed, by parting with assets. That is the part of the number worth watching, and the part the headline figure never states.
Frequently Asked Questions
Why is the latest figure only current to April 2026?
Chinese customs trade values reach the international statistical services with a lag of roughly four months, so April is the most recent month available in August 2026. The twelve-month total is used rather than a single month because Lunar New Year timing shifts activity between January, February and March and makes individual months unreliable.
Did China’s surplus grow because it stopped importing?
No. Chinese imports over the twelve months to April 2026 were 30.8 percent higher than in the equivalent period of 2019. Exports over the same span rose 59.5 percent. Both grew; the surplus widened because exports grew roughly twice as fast, which is a different phenomenon from an import collapse.
How does China’s surplus compare with the US deficit?
China’s merchandise surplus over the twelve months to April 2026 was $1.19 trillion. The American goods and services deficit over the same twelve months was $717 billion. China’s surplus is therefore 1.66 times the size of the whole American deficit, and exceeds it by $475 billion.
Who absorbs the rest of the surplus?
Every economy running a deficit against China contributes, and since the American deficit with all partners combined is smaller than China’s surplus, most of it is absorbed outside the United States. Assigning shares requires bilateral data rather than the aggregate series used here, so the article states the arithmetic constraint without naming proportions.
Does a large surplus mean China is winning at trade?
A surplus is an accounting outcome, not a score. It means Chinese residents and institutions are accumulating claims on foreign assets rather than consuming or investing the proceeds domestically. Whether that serves Chinese households depends on the return those claims earn and on what domestic consumption is being deferred to build them.
Thanks for reading! Once a surplus grows larger than the deficit everyone blames it on, the argument about it has to change shape. Happy learning with MASEconomics