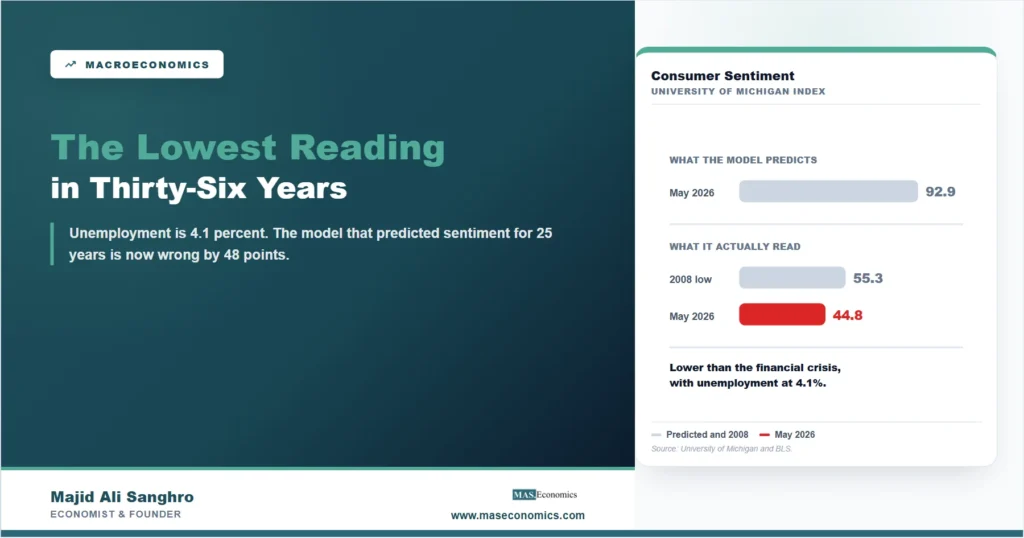
In May 2026 the University of Michigan’s index of consumer sentiment fell to 44.8, the lowest reading in the thirty-six years covered by the modern series. It recovered to 49.5 in June. To put that in context, six of the eight lowest readings since 1990 have been recorded since April 2025. The index bottomed at 55.3 in November 2008, in the worst month of the financial crisis, and at 67.4 during the pandemic. It is now below both.
At the same time the unemployment rate is 4.1 percent, initial claims for unemployment insurance are running at 199,000 a week, which is historically low, and real disposable income per head is 11.8 percent above its 2019 level. On the measures economists have used for decades to predict how people feel, Americans should be reasonably content. They are not, and the size of the gap is large enough that it is worth treating as a measurement problem rather than a mood.
The Model That Worked for Twenty-Five Years Now Misses by Six Standard Deviations
The traditional way to explain sentiment is the misery index: add the unemployment rate to the inflation rate and you have most of what you need. It is crude, and for a long time it was good enough.
Fitting that relationship properly on monthly data from 1995 to 2019, before the pandemic disturbed everything, gives a simple equation. Sentiment equals 128.3, minus 6.13 times the unemployment rate, minus 2.16 times the inflation rate. Over those 300 months the typical error is 7.9 index points, which is respectable for something this simple. A rise of one point in unemployment costs about six points of sentiment. A rise of one point in inflation costs about two.
Applied to today’s conditions, that equation predicts a sentiment reading of 92.9 for May 2026. The actual reading was 44.8. The model is wrong by 48 points, which is 6.1 times its own standard error. A relationship does not miss by six standard deviations because the mood has soured. It misses by six standard deviations because one of its inputs has stopped describing the thing people are reacting to.

The chart makes the point more plainly than the arithmetic. The two lines have not met once since the beginning of 2022. That is four and a half years in which a relationship that held for a quarter of a century has been continuously wrong in the same direction, which is the signature of a missing variable rather than of noise.
Sentiment Follows the Price Level, Not the Inflation Rate
The candidate for that missing variable is not exotic. It is the difference between a rate and a level.
Inflation is a rate of change. It answers the question “how much more expensive is this than a year ago”. People do not carry a year-ago price in their heads. They carry a remembered price, formed over several years of repetition, and they compare today’s shelf against that. When inflation falls from 9 percent to 3 percent, an economist records an improvement. A shopper records that prices went up 9 percent and then went up another 3 percent, and that nothing came back down.
That distinction can be tested rather than asserted. Taking 377 months from 1995 to June 2026 and correlating sentiment against several candidates gives a clear ordering.
| Measure | Correlation with sentiment |
|---|---|
| Cumulative price rise over the past five years | −0.535 |
| Cumulative price rise over the past three years | −0.425 |
| Unemployment rate | −0.309 |
| Inflation rate, year over year | −0.301 |
|
|
|
Every one of these is negative, which is expected: higher unemployment and higher prices both depress sentiment. What matters is the ranking. The cumulative price rise over five years is a substantially better companion to sentiment than the inflation rate is, and the gap between them is not small. The five-year measure carries a correlation of −0.535 against −0.301 for the annual rate.
This is a statistical association rather than a proven cause, and it should be read that way. But it is consistent, it is stable across a long sample covering several very different economic episodes, and it points at something specific: the index tracks how far prices have travelled, not how fast they are travelling now. The measure being quoted in the news is the one people respond to least.
The Number People Are Actually Carrying
Stated as a level, the last few years look different from the way they are usually reported.
American consumer prices in June 2026 were 30.3 percent higher than in June 2019. They were 22.9 percent higher than in 2021 and 9.4 percent higher than in 2023. That is the cumulative fact a household compares against its memory of what things used to cost, and no subsequent fall in the inflation rate reverses any part of it. Disinflation means the climbing slows. It does not mean a descent.
This is also why the improvement of 2023 and 2024 registered so weakly. Inflation came down from its peak, which economists correctly described as good news, while the price level kept rising from an already elevated base. The article on how inflation erodes purchasing power works through the same arithmetic on individual goods, and the effect compounds in exactly the way that makes it hard to feel any relief.
The current episode makes it worse rather than better. As set out in the piece on why American inflation now leads the rich world, the energy shock of 2026 pushed the annual rate back up to 4.17 percent in May. For anyone waiting for prices to feel normal again, the counter reset.
The Complication: On the Standard Measures, People Are Better Off
Here the honest version of this article has to slow down, because the obvious next step is wrong.
It is tempting to conclude that Americans feel poorer because they are poorer. The income data do not support that. Average hourly earnings for production and non-supervisory workers have risen 37.8 percent since 2019 against a 30.3 percent rise in prices, which is a real gain of about 5.8 percent, the distinction between nominal and real magnitudes doing all the work in that sentence. Real disposable income per head is 11.8 percent above its 2019 level. Real retail sales, which measure what people actually buy rather than what they say, are 16.7 percent above 2019 in inflation-adjusted terms.
| Measure | Change since June 2019 | Change since June 2021 |
|---|---|---|
| Consumer prices | +30.3% | +22.9% |
| Average hourly earnings, nominal | +37.8% | +25.3% |
| Average hourly earnings, real | +5.8% | +2.0% |
| Real disposable income per head | +11.8% | +3.9% |
| Retail sales, real | +16.7% | +2.2% |
|
|
||
So the simple story fails. People are not, in aggregate, consuming less or earning less in real terms than before the inflation. Any explanation that rests on straightforward impoverishment has to answer that table.
What Reconciles Them Is the Saving Rate
There is a figure that makes both sides of this consistent, and it is not usually part of the discussion.
The personal saving rate is 2.7 percent. Between 1990 and 2019 it averaged 5.8 percent. Americans are sustaining that 16.7 percent real increase in retail spending while putting aside less than half the share of income they used to.
Read the two together and the puzzle dissolves. Consumption is holding up, but it is being held up partly by a lower saving rate rather than entirely by rising income. That is not the behaviour of households who feel comfortable. It is the behaviour of households meeting a higher cost of living out of a buffer, and a buffer is a stock that can be run down only once.
The second reconciling figure is the choice of comparison year. Real disposable income per head is 11.8 percent above 2019, which sounds decisive, but it is 14.8 percent below its March 2021 peak, when pandemic transfers were at their largest. Economists compare 2026 with 2019 because 2019 was the last normal year. Households compare 2026 with the most recent period they remember feeling flush, and for many that was 2021. Both comparisons are legitimate. They point in opposite directions, and only one of them is used in most commentary.
The Unemployment Rate Has Also Stopped Describing the Labour Market
There is a further reason the old equation fails, and it concerns its other input.
The unemployment rate is 4.1 percent, which historically signalled a labour market where work was easy to find. Over the twelve months to July 2026 the American economy added about 316,000 jobs. A normal expansion adds one and a half to two million. Firms are not dismissing people, which keeps the unemployment rate low, and they are also not hiring, which the unemployment rate does not capture at all. The guide to how unemployment is defined and measured sets out why the headline rate misses several kinds of slack.
For anyone already employed and staying put, this looks like stability. For a graduate, a career changer, or anyone who needs a job rather than has one, it is close to a closed door, and none of that appears in the number the model uses. A low unemployment rate and a frozen hiring market can coexist comfortably, and in 2026 they do, a pattern the article on the numbers behind employment headlines examines in more detail. Two of the equation’s three terms have quietly changed meaning at the same time.
They Do Not Think It Is Over
One more series is worth adding, because it explains why sentiment has not recovered as the annual inflation rate fell.
The same Michigan survey asks what people expect prices to do over the coming year. In June 2026 the answer was 4.6 percent, after 4.8 percent in May. Households are not looking at a resolved episode. They expect roughly another 5 percent on top of a level already 30 percent above 2019, which means the memory keeps being refreshed rather than fading. The mechanism by which those expectations feed into wage and price setting, and why central banks watch them so carefully, is set out in the article on how inflation expectations work.
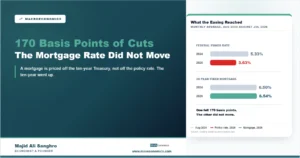
This also connects to the interest rate question. The Federal Reserve has cut 170 basis points since September 2024, and as the piece on why those cuts have not reached the mortgage market documents, the thirty-year mortgage rate is no lower than before the first cut. Someone waiting for borrowing to get cheaper has been waiting two years for a signal that did not arrive. That is a third channel through which measured improvement has failed to become felt improvement.
What Would Actually Move It, and How Long That Takes
If sentiment responds to the cumulative price rise, then the useful question is what happens to that cumulative measure, and the answer is more encouraging than the mood suggests, though slower than anyone would like.
The five-year cumulative price rise peaked at 25.3 percent in May 2025 and has already fallen to 22.9 percent. It is declining not because prices are falling but because the window is moving: each month, one month of the 2021 surge drops out of the calculation and is replaced by a more recent, smaller increase. In June 2021 a single month added 0.46 percent to the index and in September 2021 it added 0.96 percent. Those months are now leaving the five-year comparison one at a time.
That process is mechanical and it does not require any policy. It also has a long way to run and a floor. In June 2019, before any of this, the five-year cumulative rise was 7.6 percent. If inflation were to settle at the 2 percent target and stay there, five years of it would compound to about 10.4 percent, so the measure would stabilise somewhere near ten rather than returning to the 2019 figure. That is still less than half of today’s 22.9 percent.
Which gives a reasonable expectation without requiring a forecast: the gap between measured and felt conditions should narrow over the next two to three years as the 2021 and 2022 months roll out of memory and out of the arithmetic, provided inflation does not add new large increases in the meantime. The 2026 energy shock is exactly such an addition, which is why it matters more for sentiment than its size alone would suggest. Every new spike resets the clock on a process that was already going to take years.
Why This Matters Beyond the Survey
A consumer confidence index might look like a soft statistic, of interest mainly to forecasters. It has two harder consequences.
The first is that the same gap appears in every rich democracy that went through the 2021 to 2023 inflation, and it has become one of the most reliable features of the political landscape. Governments that presided over falling inflation and low unemployment have found that voters did not reward them. The economics of that is not mysterious once the level and the rate are separated: the electorate is comparing prices to memory, and no government has ever delivered a fall in the price level without a depression. It is a structural problem for any incumbent who takes the improvement in the rate as evidence that the problem is solved.
The second is a practical warning for reading data at all. The misery index did not stop working because people became irrational. It stopped working because both of its inputs, the inflation rate and the unemployment rate, became poor descriptions of what they used to describe. That is worth carrying into any indicator: a relationship that breaks by six standard deviations is telling you something about the measure, not about the people. When a model and a population disagree this violently, the honest first assumption is that the model is measuring the wrong thing.
MASEconomics Explains
3 economic concepts behind the sentiment gap
These concepts are explored in depth across our educational articles library.
Conclusion
Consumer sentiment at 44.8 in May 2026 is the lowest reading in thirty-six years, and it sits alongside 4.1 percent unemployment, historically low jobless claims and real incomes above their 2019 level. A model of sentiment fitted on twenty-five years of data before the pandemic predicts 92.9 for that month. Missing by 48 points, more than six times the model’s own typical error, is not a mood. It is a signal that the inputs have stopped measuring what they used to.
The best available explanation is the difference between a level and a rate. Sentiment correlates more closely with the cumulative price rise over five years than with the current inflation rate, and prices are 30.3 percent above where they stood in 2019. Households are not comparing this year to last year. They are comparing today’s prices to a remembered normal that no longer exists, and disinflation cannot restore it.
What makes the picture coherent rather than contradictory is the saving rate at 2.7 percent against a long-run average of 5.8. Spending is holding up, and it is holding up partly on a thinner cushion. That is the reconciliation between a population that reports feeling badly off and an aggregate that looks reasonably healthy, and it is also the part worth watching, because a saving rate is a stock that can only be run down once.
Frequently Asked Questions
How low is consumer sentiment right now?
The University of Michigan index fell to 44.8 in May 2026, the lowest reading in the thirty-six years of the modern series, and recovered to 49.5 in June. Six of the eight lowest readings since 1990 have occurred since April 2025.
Why is sentiment so low when unemployment is only 4.1 percent?
Because the traditional predictors have stopped describing what people experience. A model of sentiment based on unemployment and inflation, fitted from 1995 to 2019, predicts 92.9 for May 2026 against an actual 44.8. Sentiment tracks the cumulative price level more closely than the inflation rate, and prices are 30.3 percent above 2019.
Are Americans actually worse off than before the inflation?
On the standard aggregate measures, no. Real hourly earnings are about 5.8 percent above 2019, real disposable income per head 11.8 percent above, and real retail sales 16.7 percent above. But real income per head is 14.8 percent below its March 2021 peak, and the saving rate has fallen to 2.7 percent from a long-run average of 5.8.
If people feel this bad, why is spending still strong?
Because a falling saving rate is filling part of the gap. Real retail sales are 16.7 percent above 2019 while households save 2.7 percent of disposable income against a 1990 to 2019 average of 5.8 percent. Consumption is partly financed by drawing down a buffer, which is different from consumption financed by rising income.
Does falling inflation not make people feel better?
Less than expected. Falling inflation means prices rise more slowly, not that they fall. The level reached stays. Households compare current prices to a remembered normal, so the relief that economists record in the rate is not experienced as relief in the shop.
What do Americans expect inflation to do next?
The same Michigan survey reported expected inflation over the coming twelve months at 4.6 percent in June 2026, after 4.8 percent in May. Households are not treating the episode as finished, which is part of why sentiment has not recovered as the annual rate came down.
Thanks for reading! The gap between what the statistics say and what people report is usually a problem with the statistics, not with the people. Happy learning with MASEconomics